- Calculating Wind Speed and Direction
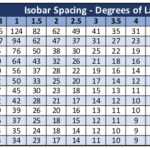
Calculating Wind from Isobars by Table Lookup There are at least two formulas I know of to estimate wind speed based on spacing of isobars on a surface analysis. Both are based on the relationship between pressure gradient (e.g. millibars per degree) and the latitude of interest. For those that are interested, a discussion of each follows. Fortunately, it is much easier to use a table where someone else has done the math for you. Calculating Wind Speed Measurement of the spacing of isobars can be done manually, or with the assistance of a tool. Here, a Surface Analysis of the Northeastern Pacific was loaded and displayed using OpenCPN, a chart plotter program. The shaded circle highlights the area of interest which is located on latitude 40. The two black arrows point to each end of a measurement tool. The yellow box indicates a measurement of 102nm. Divide 102 by 60 to get the the number of nautical miles in 1°. In the example, there are 1.7° between the two isobars, falling between two table columns. 40° latitude at 1.5 isobars/degree equals 33 kts winds. 2.0 isobars/degree equals 25 kts. 30 kts is a reasonable estimate of winds in the area. Estimated Wind Direction Estimate wind direction by looking at the direction of the isobars. Wind blows out of the high by 15° to 30° and into the low by the same. Interestingly, in both cases, subtract 15° to 30° from the direction of travel of the isobar for an estimate of wind direction. Estimate wind direction in the example by taking the angle of the measurement (325°) and subtracting 90°. Resulting in the direction the isobar is coming from (235°). The wind travels into the low by an angle of 15° to 30°. Resulting in an estimated wind direction of 205° to 220°.
- Create a Universal Plotting Sheet
There may be times when a navigation chart showing contours along the coast and/or navigational hazards is not needed. This is generally the case with celestial navigation, however, you may also find times while piloting along a coast that this is the case. An example might be that you prefer to keep your DR and Fix plotting off of the navigation chart in order to keep it more readable. Using a Universal Plotting Sheet allows you this flexibility. Universal Plotting Sheets may be purchased in pads of 50, or they may be downloaded from the internet. Generally, they will include a compass rose in the center, three pre-drawn latitude lines, and one centrally located line of longitude. They are printed with “minute” marks (miles) for latitude and a scale to use in determining minutes of longitude. Having a pad on board is always a good idea. Unfortunately, having a pad on board is not always the case, and “using the up” during practice can be expensive and frustrating. Fortunately, there is another solution. You can use any conveniently sized paper (e.g. 8.5 x 11) to make your own. I personally like to just use a blank notebook as a navigation log, and use a blank page in it to create universal charts as needed. Here is how. Plot The Primary Latitude and Longitude Lines Step one: Using a convenient size of paper (in this case, 8.5 x 11), draw a horizontal line and a vertical line at approximately the center of the page. Label the horizontal line with the desired latitude and the vertical line with the desired longitude. In the example, Latitude 39N and Longitude 122 W were selected. Draw an Angle Representing Your Latitude Step two: Draw an oblique (diagonal) line representing the angle equal to the center longitude line. Here, the line is drawn at a 39 degree angle from the horizontal line. Mark the oblique line in increments equal to the scale you have decided to use. I chose to use a scale of 1/2 inch for every 10 miles. Six equally spaced divisions every 1/2 inch is equal to 60 miles, or 1 degree of Latitude. Find Your Longitude Lines and Minute Gradations Step three: Drop a vertical line from the sixth diagonal division mark to the center latitude line. This line marks the location of the next degree of longitude. Draw another vertical line an equal distance away from the center longitude line on the opposite side. Your universal plotting sheet now includes 2 degrees of longitude. A final part of this step is to drop a mark straight down from each diagonal division down to the center latitude line. Each mark on the latitude line is equal to 10 minutes of longitude and each mark on the oblique line is equal to 10 minutes (miles) of latitude. Find The Latitude Lines Above and Below the Primary Latitude Line Step Four: Using dividers, measure the length of the oblique line from the center to its intersection with the longitude line. Swinging the dividers so it scribes an arc across the longitude line above and below the center latitude line provides the limits of one degree of latitude above and below the primary latitude line. Set Up The “Minute” Marks Step five: Finally, graduate the oblique line into convenient units. In the example, each marking is 2 minutes (miles). And, graduate a section of the latitude line into similar units. Your Universal Plotting Sheet Is Ready To Use Good news! You are ready to go. As drawn your plotting sheet covers an area of about 180 mile (E/W) by 130 miles (N/S). A small amount of practice is all you need to get proficient. A Final Note When using a universal plotting sheet, “standard” plotting tools may be a bit unwieldy. My personal preference is to use a 5 inch Douglass Protractor. It seems to be the perfect size to use with an 8.5 x 11 sheet of paper, and is conveniently marked off in 1/2 inch increments. As a bonus, each 1/2 inch is further broken down into 5 divisions, which can be used to represent 2 miles on the latitude scale. With those divisions marked on the plotting sheet is is very easy to interpolate into smaller distances.
- Global Circulation
An Island in the sun Back to our island in the sun image. Although not apparent in the image, the rays of the sun do not directly heat the atmosphere. Instead, the sun’s rays heat the land, which in turn heats the air. It’s clear from this small-scale model the sun is the driving force behind the movement of air in this case. But, how about on a larger, global scale. Is the sun still the motivating factor? Yes! Hadley Cells The more directly the rays of the sun impact the Earth, the more energy is transferred, heating the Earth and the atmosphere above it. The sun is located more or less over the equator (more on that later.) The portion of the Earth’s surface near the equator is heated more causing it to rise vertically. Image by NASA Hadley cells are the basis for our understanding of global-scale meteorology. The heated air from the equator begins to move toward the poles and to cool. As the air cools, it begins to descend back to the Earth’s surface. The cooling air descends about latitude 30, causing a “pile” of extra air to end up at that location. This is referred to as an area of high pressure. As the cooled air reaches the Earth’s surface it heads back to the equator. All the while, the Earth is spinning beneath the atmosphere, resulting in wind moving in a more or less Northeast to Southwest direction (in the Northern Hemisphere). These winds are referred to as the Trade Winds. Known as a Hadley cell this movement of air forms a convection cell that dominates tropical and sub-tropical climates in the lower latitudes (0 to 30 degrees). Ferrel Cells Ferrel Cells are an atmospheric circulation cell occupying the mid latitudes (30 to 60 degrees). In this cell the air flows poleward and toward the east near the surface and toward the equator and westward at higher levels., rising around 60 degrees and descending around 30 degrees. Polar Cells With a Polar cell, the air rises from around latitude 60 and travels toward the poles. Once over the poles, it sinks, forming the polar highs. At the surface air diverges out and away from the pole. Surface winds blow from the east (polar easterlies). Global Wind Belts There are three global wind belts north, and three south of the equator. As mentioned earlier, located close to the equator are the Trade Winds (also known as the Tropical Easterlies), blowing from east to west. Located from around 30° to 60°are the Prevailing Westerlies coming out of the west. Finally, north and south of 60° are the Polar Easterlies. Bands of High and Low Pressure Between the Hadley cells and the Ferrel Cells is a band of high pressure at the surface. The high-pressure band is located about 30° North and 30° South latitude. There is also a high pressure area at each pole. Low pressure bands are found at the equator and 50° to 60° North and South latitude Hot and dry weather is associated with high pressure. Rainy and stormy weather is associated with low pressure. The region between 50° and 60° latitude (north and south) tends to have more precipitation due to more storms moving around the earth at these latitudes, especially along the west coast of continents. Many of the Earth’s desert areas are located along latitude 30°, and large high pressure areas are found there in the middle of oceans. Seasonal Changes Due to the tilt of the Earth, the sun is directly over the equator only twice a year, on about March 20th and September 22nd. During the summer and winter, the sun slowly “moves” north and south of the equator to a maximum of 23.44° north on about June 21, and 23.44° south on about December 21 . The maximum latitude marking the sun’s location is known as the Tropic of Cancer in the north, and the Tropic of Capricorn in the south. The tropics lie between the Tropic of Cancer and the Tropic of Capricorn. North and south of that are the temperate zones. As the sun moves, the Hadley Cells, Ferrel Cells, and their associated high and low pressure systems also move. The perfect example is the semi-permanent North Pacific High. Center about latitude 30, the North Pacific High moves north in the summer to roughly 38°. Air Masses One final topic to introduce is air masses. An air mass is a volume of air covering hundreds or even thousands of square miles. It’s defined by its temperature and water vapor content, and falls into one of five types. Understanding air mass types becomes important later on when we discuss fronts. Maritime Tropical (mT) air masses form over warm water areas of the tropics, and consist of warm moist air. When you think of Maritime Tropical, think hot and humid. As the name suggests, Maritime Polar (mP) air masses form over cooler marine environments, and are responsible for cloudy damp weather. Continental Tropical (cT) Continental tropical air masses are hot and dry. They usually form over a desert area during summer. Continental Polar (cP) consists of cold and dry air. These often dominate the weather picture across the USA during winter. These air masses are the ones responsible for bringing clear and pleasant weather during the summer to the north. Except in rare circumstances, a Continental Arctic (cA) air mass is not of concern to the typical sailor. An Arctic air mass is identified by extremely cold temperatures and very little moisture. These usually originate north of the Arctic Circle, however during winter may plunge south.
- Marine Weather Intro
Knowledge of the weather is as crucial to today’s sailor as it was two hundred years ago. Fortunately, advances in technology have put weather forecasting capabilities within the grasp of the average sailor, who with the click of just a few buttons can bring up surface analysis maps which draw on the talents of some of the world’s most knowledgeable meteorologists. With analysis in hand, and a relatively small degree of knowledge, every sailor is better prepared to face conditions at sea. I am not a trained meteorologist. I’m simply a sailor who found a need to learn a little about the weather. A first glance at a surface analysis contains a vast array of confusing symbols and colors. It must require nothing short of genius to interpret. Fortunately, that couldn’t be further from the truth. With a short amount of study, the isobars, high-pressure and low-pressure areas, cold and warm fronts, troughs, and ship reports begin to jump off the page to explain why it’s raining right now. Or, you can expect stormy conditions tomorrow. Therefore, it is a good day to stay at home by the fire. So, enjoy a good book and excellent company. What is the most important aspect to know about the weather? Ask this question of five sailors in a bar, and you will likely get six different answers, mostly focused on storms. Not true. Knowing the wind is the number one factor a sailor can know. Will there be too much or too little? Interestingly, too little is more often the case, and part of the task of a good navigator is to plan the route that offer the best wind for the sailing destination in mind. Whether that destination is a day sail on San Francisco Bay, or a Pacific Puddle Jump from Mexico to French Polynesia, understanding where the wind is, and effects of land and latitude go a long way to making the voyage safe and enjoyable. My goal with this website is to aid you in becoming a knowledgeable navigator. Each article is designed to further your education. In effect, it is an online training class composed of blog posts, videos, and practice exercises. Each post is topical. In chronological order, we explore weather beginning on a global scale. Going from high level to a detailed view, we look at all aspects of weather, right down to local effects. For example; why does wind typically blow from the Northwest along the central coast of California? However, why does it suddenly change to a Southwest wind in San Francisco Bay? How is that same wind is impacted by Alcatraz Island sitting the middle of the bay. All weather is based on the relationship of the Sun to the Earth. Warm air rises. Cool air sinks. The Earth “rotates under the Sun.” Driving all of the weather patterns we experience. Let’s start our weather education with a simple drawing of a large scale process scaled down to size. An Island in the Sun A great deal of information is found in this simple image. Some of it is obvious, and some not. The sun heats everything, however, land heats faster than water. Warm air rises. In this case, the “packet” of air directly above the island moves upward. Warm air is able to hold more moisture than cooler air. Wind is the movement of air from one place to another. As the packet of warm air rises, it begins to cool back down. When the packet of air cools to a certain point (called the dew point) it condenses into clouds. At some point, the cooling air begins to move away from the newly arriving warmer air. The cooled air begin to sinks, replacing the cool air moving toward the island. The rising warmer air over the land creates an area of lower pressure (less air). The sinking cool air creates an area of high pressure (more air). Here’s another visual for you. The packet of air above the island is like a hot air balloon. As the air inside warms, the balloon rises. Just like the air in the balloon the packet of air rises as a unit. Warming, rising, condensing, and moving away from the source of the heat more or less as a single unit. That’s enough for now. In the next post, we look at the same process on a global scale.
- Navigation Exercises – Golden Gate to Pillar Point
This navigation exercise requires Chart no. 18645 – Gulf of the Farallones Parallel rule Calculator Pencil Exercise 1 It is June 4, 2020 and you are headed to Pillar Point for the weekend. Slack before flood is at 0724, so you time your arrival at the bridge for 0730. You arrive at R”8” (37° 46.55′ N, 122° 35.18′ W) in the Main Ship Channel at 0830 and turn to 180 (166M). There is fog along the coastline and you can’t see any landmarks or nav aids. Your vessel speed is 6 knots. First, Plot your DR ahead for the next 2 hours (1030). The fog has cleared enough at 0951 to take a bearing of Pt San Pedro Rock. It is 122M and is 045 degrees relative off the port bow. What is your DR Lat and Lon? Use the bearing to determine your estimated position. What is the EP Lat and Lon? Exercise 2 Continuing on your trip, at 1018 Pt San Pedro Rock bears 090 relative. Hint: Forget the EP. Continue with the DR plot. What is your distance off? Using distance off LOP and the bearing LOP to Pt San Pedro Rock to get a fix. What is your Lat and Lon? Advance the 0951 bearing to Pt San Pedro Rock forward to 1018. What does this do to your fix? Exercise 3 Continuing on your course of 180T, you plan to turn towards the Pillar Point approach buoy (RW “PP” (37° 28.35′ N 122° 30.83′ W) when abeam of R “26” (37° 32.17’ N, 122° 33.09 W). What is the ETA to the turn? How far away from R “26” are you set to pass? What is the bearing (M) to the Pillar Point radar tower when you make your turn abeam R”26″? What course will you turn to head for RW “PP” (37° 28.35′ N 122° 30.83′ W)? What is your ETA at RW “PP”? Exercise 4 Continue on a course to take you into Pillar Point Harbor. Set up two danger bearings to guide you between the two reefs. Danger bearing 1 i a line from G”1″ to G”3″. Danger bearing 2 is a line from PP to R”2″. In degrees magnetic, what are the two danger bearings? Remember to label NMT or NLT. What course would you follow from your turn near PP to travel through the channel? Once clear of the channel, what course would take you to the entrance of Pillar Point Harbor?
- Navigation Triangles
Plotting Tool Options There is a wide array of tool options to assist you in navigation plotting. All have pluses to recommend them as your “go to” tool. Unfortunately, all also have cons that make them less desirable or more challenging to use. This tip is specifically how to use navigation protractor triangles (just call them triangles). For a discussion of the plusses and minuses of the other options, check out the lesson on “Navigation Tools – Plotting Tools“ Using Navigation Triangles Why Triangles (aka: What is a Protractor) Before we talk about why I prefer using triangles over the other plotting tool options available to me, let’s talk about the down side. Quite simply, there is a bit of a learning curve to use them well. However, most everyone that I know who has learned to use them asks why they thought it was hard. That’s it, the down side is a pretty short list. The Up Side (why I prefer them) They are less prone to slipping when you are using them. Think rolling boat in 6 foot seas. Less tool slippage is good! They are more accurate. Using the compass rose to read directions at best you can see 1 degree of accuracy at best. Using a triangle actually allows you to estimate directions that fall between the 1 degree marks. There is a built in “reciprocal” scale. One of the more common mistakes I see is marking the reciprocal of the course you want. For example, a course of 260 marked as 080. One time, in a class I was teaching, we were leaving Santa Cruz Harbor. The first course to get out was marked correctly. The second course was inverted to the reciprocal of the correct course. 180 degrees the wrong way. I noticed the error, but let it happen as a learning experience. The net result. When we made the turn to the new course we were pointed directly at some rocks. The class realized right away there was a problem, figured out what the problem was and fixed it. That was in clear weather. Would they have realized it in fog? There is a built in scale of “Cardinal” and “Intercardinal” Points.Whoa … what is that? Cardinal Points are North, East, South, and West. Intercardinal Points are in between. For example, between North and East there are NNE, NE, and ENE. There is a built in milage scale.If you are using a chart with a 1:80,000 scale (check the scale Martha’s Vineyard to Block Island Training Chart) you don’t have to mess with the latitude scale to find mileage. It is build in along the long edge of the triangle. 1:80,000 is a very common scale. How to Use Navigation Triangles Drawing a Course Line To draw a course line from Point A to Point B, you pretty much need a straight edge long enough to stretch from one point to the next. A single triangle is about 10 inches long. Two of them laid long edge to long edge will easily stretch 18 inches. Drawing a line longer than that will require a separate straight edge, such as a ruler or that parallel rule sitting unused in your navigation tool drawer. For example purposes, let plan a course from the Pillar Point safe water mark outside Half Moon Bay (orange arrow in images) to Drakes Bay, going around the west side of Southeast Farallon Island (green arrow in images). Knowing that Southeast Farallon Island can be dangerous, we will plan to stay in water deeper than 60 feet (10 fathoms). We will also plan to stay .5nm away from the green buoy marking the reef at Drakes Bay (pink arrow in images). The Second Half of Voyage Determining Directions of a Course Line One of the most common tasks to be done during navigation is to determine the direction of a line. It might be a course line. It might be bearing to an object. Or, you might be setting up a straight edge to draw a line. Whatever the reason, this task will be done over and over. The Process The first thing to ask is; “Does the “line” cross any line of longitude printed on the chart.” If it does, your job is easy and only one triangle is needed. Hold the triangle’s right angle toward you. There is a black line etched into the long side of the triangle. It is about 3/8 inch from the edge. There is a hole in the middle of the etched line. Put that hole directly on top of the spot where the line to be measured and the longitude line cross. Rotate the triangle so the etched line is on top of line you want to measure. Read the direction from where to line of longitude “exits” the triangle. Remember that the triangle reads both directions the line travels. Make sure you use the correct angle, not the reciprocal. Any direction that heads east of the North/South line uses the smaller numbers. Any direction that heads west of the North/South line uses the larger numbers. If the line does not cross a printed line of longitude two triangles are required. Tangents (aka: How do I Know When I am Abeam an Object?) There are occasions when it is beneficial to know at what point you will be abeam a specific object. With triangles, this is a snap. Simply lay the long edge of the triangle on the course line. Butt the 90° angle of the second triangle against the first and move it so the other short edge passes through the object. Triangles and the Compass Rose When using navigation triangles, the compass rose found on every chart is only used for one thing. To determine variation. Since you will not be “walking” the course/bearing line over to the compass rose, you can not use it to determine magnetic directions. When using navigation triangles, all directions will be in degrees true. Calculations must be done to convert to “magnetic” or “per ship’s compass”. If you need a refresher on how, help can be found at TVMDC. Help to Remember How to Find Courses and Bearings Using navigation triangles can be a bit frustrating at first. Here are two pieces of advice to help you during the learning process. To find the direction of a course line, first lay the black course line on the triangle on the drawn line, then use a straight edge to move the triangle’s focal point to a line of longitude. To draw a specific course or bearing line, first find the correct direction by placing the focal point on a longitude line and rotating the triangle, then use a straight edge to move the triangle to the bearing object or course starting point. Put Another Way If you know the bearing, locate the bearing and move to the line. If you know the line, locate the line and move to a longitude line to find the bearing.
- Pillar Point to Drakes Bay
You just finished a wonderful dinner and are back on the boat. It’s Thursday evening, and decision time. Do you return home or head up to Drakes Bay for a day or two. Time isn’t an issue. You don’t have to be back until Sunday, or even later if you want. Weather forecast for the next three days. What is your decision? Motor Back Home Motor Directly to Drakes Bay Sail to Drakes Bay Via the Farallon Islands? So, you chose Sail to Drakes Bay via the Farallon Islands Personally, I think you made the best choice. Leaving Pillar Point Harbor, you head to PP, the Pillar Point Approach Buoy where you raise your sails. Wind is from the NW (315 T). Assume your boat is able to sail to 45 degrees off the true wind, and that your speed will be 5 kts. What is the heading of a direct line from “PP” to the Farallon Light? What is your initial heading under sail? What heading will you tack to? Let’s assume you stay on your initial heading for 3 hours (at 5 kts) before tacking. What is your DR lat and long when you make your first tack. Sunrise is 0547 on June 5 . Sunset is 2029. Assume it takes 45 minutes from your slip to “PP.” If you are able to maintain 5 kts all day, what is the latest time you would need to leave your slip in order to reach your anchorage at 38°00.0′ N; 122°58.5′ W in Drakes Bay before sunset? Plan to go around the west side of Southeast Farallon Island then between Southeast Farallon and Middle Farallon towards Drakes Bay. Answers: No peaking until after you have done the work. What is the heading of a direct line from PP to the Farallon Light? 300 T What is your initial heading? 270 T What heading will you tack to? 360 T Let’s assume you stay on your initial heading for 3 hours (at 5 kts) before tacking. What is your DR lat and long (to the nearest 0.1′) when you make your first tack. 37°28.4′ N; 122°49.7′ W Sunrise is 0547 on June 5 . Sunset is 2029. Assume it takes 45 minutes from your slip to PP. If you are able to maintain 5 kts all day, what is the latest time you would need to leave your slip in order to reach your anchorage at 38°00.0′ N; 122°58.5′ W in Drakes Bay before sunset? Plan to go around the west side of Southeast Farallon Island then between Southeast Farallon and Middle Farallon towards Drakes Bay. 0803 Assuming you leave your slip at 0615 and it takes 45 minutes to reach PP, what is your ETA at the southern traffic lane? How long will it take to cross the lanes? At 1425, you take a bearing of Farallon Lt. bears 004 M, and your depth sounder reads 180 feet. What is your Lat and Long? What course should you steer to put you back on course to round the “back” side of Southeast Farallon? At 1451, you get a bearing of 093M to Farallon Lt. Use the 1425 bearing and the 1451 bearing to get a running fix. What is the Lat and Lon? Answers: No peaking until after you have done the work. Assuming you leave your slip at 0615 and it takes 45 minutes to reach PP, what is your ETA at the southern traffic lane? 0819 How long will it take to cross the lanes? 49 minutes At 1425, you take a bearing of Farallon Lt. bears 004 M, and your depth sounder reads 180 feet. What is your Lat and Long? 37°40.6′ N; 123°00.7′ W What course should you steer to put you back on course to round the “back” side of Southeast Farallon? 325T to 335T At 1451, you get a bearing of 093M to Farallon Lt. Use the 1425 bearing and the 1451 bearing to get a running fix. What is the Lat and Lon? 37°42.4′ N; 123°02.1′ W
- Pilot Charts
What Are Pilot Charts? Pilot Charts provide the navigator with averages. Averages concerning prevailing winds and currents, air and sea temperatures, wave heights, ice, visibility, barometric pressure, and weather conditions. There are five volumes of Pilot Charts, each being its own publication, and each covering a specific geographic region. Each publication is actually a compilation of twelve individual pilot charts, one for each month of the year. Pilot charts are intended to aid the navigator in selecting the fastest and safest routes with regards to the expected weather and ocean conditions. Pilot Charts are not intended to be used for navigation, however, they are invaluable in planning stages of a voyage. https://msi.nga.mil/Publications/APC Coverage Areas Pilot Charts may be downloaded from the Maritime Safety Information Publications website. As can be seen in the image below, there is a great deal of information contained in a pilot chart. Most of this information will be explored and interpreted as we move through this post. In this case, we will be looking at average conditions in the North Pacific Ocean in the month of July. One very nice feature of a Pilot Chart is that it not only contains the data, but also instructions on how to use and interpret the data. Pilot Charts are very much self contained. The Main Body of the Chart Wind Roses As a sailor who primarily is interested in wind driven vessels, my primary concern when it comes to sailing is the wind. Will there be enough? Too much? What direction will it be coming from. Fortunately, typical wind conditions is one of the primary pieces of information found on a pilot chart. Every 5 degrees (300 miles), east and west as well as north and south is a wind rose. Understanding the wind rose is critical to proper use of a pilot chart. Wind Arrows There is a wind rose sitting just offshore from San Francisco. Because of the land mass and printed information on the chart, it can be a challenge to read this rose, but let’s give it a try. We will start by looking at the wind arrows. There are eight of them, marking the cardinal (N,S,E,W) and intercardinal (NW, SW, SE, NE) compass points. The length of the arrow shaft tells you the percentage chance of wind from that direction (more on measuring it in a minute). In this case, the arrow coming from the NW has the number 45 printed on it. Any time a wind arrow is “too long”, it is shortened to a set maximum length and the percent chance of wind from that direction is printed. Also included as part of the wind arrow are “feathers” arranged on each side of the shaft. There are four arrows, two on each side. The arrows indicated the Beaufort force of the wind coming from the indicated direction. That one arrow now tells us there is a 45% chance of force 4 winds (11-16 knots) coming from the northwest. The length of the arrows not labeled with percentages can be measured and compared with a scale found on the chart. A quick measurement with dividers provided an 18% change of wind from the north at force 5 (17 to 21 knots). Calm Days The final item relating to the wind rose is the number within the circle at the center. In this case, “8”. There is an 8% chance of a calm day (less than 1 knot of wind). Wave Heights Before we move to the next graphic, the is one more piece of information found in the graphic above. The red solid line indicates the percentage change of 12 foot or greater waves during the month. Directly off of San Francisco, it is statistically rare, but it may happen. However, a bit to the north there is a 10% chance of 12′ or greater waves. San Francisco to Cabo San Lucas in November Before we move on to the next topic, here is a quick planning exercise for an imaginary trip from San Francisco to Cabo in November. Off of San Francisco, about 40% of the time the wind will be out of the N or NW at force 4, with calm days expected only 2% of the time. Waves of 12 feet or greater are expected 10% of the time. Near Los Angeles, the wind will be out of the N or NW at force 4 about 76% of the time. Nearing Cabo, the prevailing winds are still out of the N or NW over 70% of the time, however, the intensity has dropped to force 1 (1 to 3 knots) Surface Currents A new piece of information contained on the chart also presents itself in this exercise. The green arrows represent the expected current in the area. Mostly going down the coast on this trip, currents of .4 to .5 knots will help you on your way. However, if you look close, near shore north and south of San Francisco is a counter current heading north at .6 knots. Staying close to shore could add an extra 4 hours to your trip during the first 200 or so miles. Two additional topics covered in the main body of the Pilot Chart that may not be of general interest to most sailors are the limits of ice during the month, and a plot of great circle routes (including distance) between a number of major ports. It is nice to know where they are, and the distance from place to place. San Francisco to Yokohama is 4452 and is composed of an arc starting at the 38th parallel, then traveling as high as the 48th parallel before dropping back down to latitude 35. Average Weather Conditions In the upper left of the chart is a general text description of the average conditions of wind and weather. Topics covered include: Winds Pressures Visibilities Gales Extratropical Cyclones Tropical Cyclones Air Temperature Wave Heights Average Ice Limits Frequency of Wave Heights Sub Charts In Addition, graphics of the topics shown above are included. Air and Sea Temperature A sub chart is included (not shown) indicating average air and sea temperatures in the area for the depicted month. Ice Limits Great Circle Routes
- Pressure Systems
What is Wind The title of this topic might have been “What causes the wind.” Quite simply, wind is moving air. Air doesn’t seem like much, however, it has weight and it has substance, and is actually considered a fluid. This becomes apparent when air moves. While moving, you can see many of the same characteristics you might find in a river. Things like moving as a “unit,” parting and coming back together as it flows around an obstacle, and eddies or back-flows. Air moves from an area of higher pressure into an area of lower pressure. The closer together the high and low pressure is and the greater the difference in pressure, the faster the air flows. Air has weight The temptation is to believe air has no weight, which isn’t true. Logically, it must have weight. If not, you wouldn’t be able to feel the wind on your face while sailing, and your sails would hang limp even in a fresh breeze. If you weigh the column of air directly above you, it would weigh approximately 14.696 pounds per square inch. This is also known as the standard atmospheric pressure. As the graphic demonstrates, there are a number of labels to use when expressing standard pressure. All represent the same value. In the maritime world, millibars (mb) are used. Standard pressure in millibars is 1013.25(mb). Throughout these lessons, we will be using millibars to express atmospheric pressure, however, you may have occasion to check weather briefings and forecasts that use other units of measurement. For example, aviation forecasts typically use inches of Mercury (Hg), where standard pressure is 29.9212 inches (Hg). Atmospheric pressure is also known as barometric pressure. In the Island in the Sun analogy in An Introduction to Marine Weather, heated air ascended traveling away from where it rose where it was added to the “pile” of air at another location, creating a higher pressure. There are other ways in increase atmospheric pressure in a given area. For example, cold air is heavier the warm air. Moisture laden air is heavier than dry air. Consequently, all of these factors are added together to determine pressure in a given area. High Pressure vs. Low Pressure Relatively small variations in pressure determine the wind and storm patterns around the world. The highest pressure every recorded was 1083.98 mb at a location in Siberia. Whereas the lowest, 877.07, occurred in the eye of a South Pacific typhoon. In contrast, most readings fall between 975 mb and 1050 mb, a pressure difference that can easily result in wind speeds in excess of 50 kts! Pressure gradient Pressure gradient is the change in pressure measured across a given distance. Air flows from the high to the low because the pressure gradient creates a net force that starts the movement of air. The greater the pressure change over a given distance the greater the net force. Coriolis Effect Air moves from higher pressure into lower pressure, however, not in a straight line as demonstrated above. Instead, something called the Coriolis Effect causes the air to deflect to the right around the high pressure area. The Coriolis Effect describes the bending of the trajectory of an object as it travels. In the Northern Hemisphere, air that is moving out of a high pressure system towards an area of lower pressure bends to the right. Clockwise Around the High Here’s some good news. Unless you are a scientist or a mathematician, it really doesn’t matter to weather forecasting? Just remember, in the northern hemisphere high pressure systems rotate clockwise and low pressure systems rotate counter clockwise. The wind travels slightly out of the highs and slightly into the lows. The opposite is true in the southern hemisphere. Around and Out We now know the net force resulting from the pressure gradient gets the air moving out of the high, towards the low. Once moving, the Coriolis Effect begins to turn the moving air to the right. The air continues deflecting to the right until the net force of the pressure gradient and the turning force of the Coriolis Effect balance each other out. As a result, the air flows clockwise around and out of the high by 15° to 30°. Isobars Isobars are the contour lines of atmospheric pressure. They are a series of lines on a map connecting points having the same atmospheric pressure. Each isobar is labeled with its represented pressure, generally with a four millibar spacing. In this surface analysis forecast example, a high pressure area can be seen on the left side of the image, slightly below center at latitude 40N. The “H” indicates the center of the high. The expected high pressure there is 1034mb. It’s important to note the “1034” label is underlined, and is not found at the actually location of the highest pressure. In this case, it is slightly above and to the right. The first isobar out from the “H” is 1032mb and includes just the last two digits of the pressure (32). Each successive isobar is 4mb less than the one before; 28, 24, 20, etc. Moving to the upper right on the map, is a low pressure area with an atmospheric pressure of 999 in the position of the X next to the “L”. Although not marked, the small circle surrounding the “Lx” represents a pressure of 1000 isobars. Take a moment to locate and identify the pressure for each isobar between the areas of high pressure and low pressure.
- Rose’s Intro to Navigation
Finding Latitude and Longitude Lines of latitude run east and west (across the chart). Lines of longitude run north and south (up and down). Degrees of Latitude Zero degrees of latitude is known as the equator. Latitude goes from zero degrees to 90 degrees north and south of the equator. As can be seen in the image above, Lines of latitude run parallel to each other. There are 60 nautical miles between each degree of latitude. Lines of latitude are a consistent distance apart, so they can be used to measure distance. One degree of latitude can be divided into 60 “minutes”. Each minute of latitude is one nautical mile. A minute of latitude can be further divided into 60 seconds. However, it is more common today to divide minutes into tenths and hundredths of a minute. The chart examples below all degrees, minutes, and tens of a minute for both latitude and longitude. Degrees of Longitude Zero degrees longitude (also known as the prime meridian) runs through Greenwich England. Longitude goes from zero degrees to 180 degrees east and west of Greenwich England. At the equator lines of longitude are about 60 miles from one degree to the next, however, as can be seen in the image, lines of longitude come together at the poles so they can not be used to measure distance. A degree of longitude an be divided into 60 minutes and 60 seconds (or into tenths and/or hundredths). Finding the location of Half Moon Bay Putting this information together, the latitude and longitude of Half Moon Bay near San Francisco is 37° 30′ N and 122° 30′ W. Which means 37 degrees 30 minutes north of the equator and 122 degrees 30 minutes west of Greenwich England. First Lat Long Exercise Use the dashed blue lines to find the latitude and longitude of the buoy named R”26″ Fl R 2.5s. Parallel Rule One navigation tool you will use a lot is the parallel rule. It is two straight edged “rulers” placed side by side and connected with hinges. These hinges allow you to separate the rulers, moving them further apart, while staying perfectly parallel with each other. Using them, you can “walk” a line from one location on the chart to another, and know that the line is parallel to the original line. Charts have “major” latitude and longitude lines printed directly on the chart for reference. In the case of the chart image above, latitude 37° 30′ and 122° 30′ have been printed in black on the face of the chart. To use a parallel rule, line one of the outside edges along a printed line of latitude or a line of longitude. Hold that side rule firmly in place and separate the two rulers, “walking” it up to the object you are concerned with. In the case above, buoy R”26″. Draw a line from the “object” to the latitude scale to find the latitude of that object. Repeat the process using a line of longitude to come up with the latitude and longitude of that object. Finding an Object or Location at a Known Latitude/Longitude The parallel rule can also be used to find an object or location on the chart when only the latitude and longitude are known. The given latitude and longitude of 37° 28.3′ N and 122° 30.9′ have been highlighted. Set up the parallel ruler on the printed latitude line. Hold one firmly rule in place while the other is moved down the page to line up with the highlighted latitude. Repeat with a line of longitude and the highlighted longitude. The object, in this case buoy RW”PP” should be found at the intersection of these two lines. Latitude and Longitude/Parallel Rule Exercise Download and print the attached portion of chart 18645 for an exercise in finding latitude and longitude. Finding Objects from Latitude and Longitude What is the name of the object at 37° 59.0′ N; 122° 57.3′ W (label it as point “A”) What is the name of the object at 37° 51.6′ N; 122° 41.7′ W (label it as point “B”) Finding Course/Direction Course and/or direction is also found using the parallel rule. Simply lay one edge of the rule from one point to the next and draw a line between the two points. Hold one side of the rule in place and walk the other side to the “+” located in the center of the compass rose. Mark the course. Lay the parallel rule along the course of travel. In this case, from RW”PP” near Half Moon Bay to the Farallon Islands. Draw a line along the direction of travel. Hold one side of the parallel rule in place and move the other side to the small “+” in the center of the nearest compass rose. Mark the course along the degree scale of the rose. Here is a close up image of the compass rose showing course line and the the degrees both marked. In this case, the course is between 298 and 299 degrees. Always make sure your course is marked in the same direction from the center of the rose as your direction of travel! Course Exercise Use the chart you downloaded and printed earlier. Assuming that you have found the two buoys, lay one edge of the parallel rule between them. Draw a pencil line. Now, hold the side of the rule in place that connects the buoys and move the other rule to the small + in the middle of the compass rose. Where the parallel rule “exits” the compass rose is the direction (or course) from one buoy to the other. Caution – if you are traveling from point A to point B, the course will be in the same direction of travel from the + to the outer ring of the compass rose. What is the course? Distance Distance is calculated by comparing the distance between two points with the latitude scale. The easiest way to do this is by using dividers. The dividers are set to 5 minutes of latitude. Remember, each minute of latitude equals 1 nautical mile. “Walk” the dividers along the course line. Most likely the last step will be past the end point. Narrow the dividers down to stop at the end point and compare this measurement with the latitude scale. The distance is the combined total of all the “steps” of walking the dividers. Distance Exercise What is the distance from Point A to Point B on the downloaded chart? Distance Speed and Time The relationship between Distance Speed and Time is critical in navigation. If you know any two them, the third can be easily calculated. Distance divided by Speed Equals Time (in hours and tenths of an hour) Distance divided by Time Equals Speed Speed multiplied by Time Equals Distance D Street Triangle Using the results of the last exercise. If you travel from Point A to Point B you have traveled 14.4 miles. If it took you 3.1 hours (which is 3 hours and 6 minutes) the equation would look like: 14.4/3.1 = 4.6 knots Let’s take the same situation, but this time assume your boat speed is 6 knots. How long will it take to travel the 14.4 miles? If you leave at 10:00AM, what is your estimated time of arrival? Fuel Consumption GPH On a boat, fuel consumption is referenced as Gallons Per Hour. Here is a hint for you on fuel consumption calculations. Per always means divided by when used in a math equation. If you use 3.75 gallons of fuel over a 5 hour period of time. Your GPH is 3.75 / 5 = .75 gallons per hour Using the same reasoning, GPH times the hours underway equals the total fuel used. .75 GPH for 12 hours equals 9 gallons of fuel used. F / T = GPH GPH * T = F F / GPH = T If your boat consumes .6 gallons per hour, how much fuel would you use traveling from Point A to Point B in the above example? If you have a 30 gallon tank and you want to keep a minimum of 25% in reserve, how much usable fuel do you have? Based on that amount of usable fuel, how long can you motor at .6 GPH? At a boat speed of 5 knots, how far will you travel during that time?
 Calculating Wind from Isobars by Table Lookup There are at least two formulas I know of to estimate wind speed based on spacing of isobars on a surface analysis. Both are based on the relationship between pressure gradient (e.g. millibars per degree) and the latitude of interest. For those that are interested, a discussion of each follows. Fortunately, it is much easier to use a table where someone else has done the math for you. Calculating Wind Speed Measurement of the spacing of isobars can be done manually, or with the assistance of a tool. Here, a Surface Analysis of the Northeastern Pacific was loaded and displayed using OpenCPN, a chart plotter program. The shaded circle highlights the area of interest which is located on latitude 40. The two black arrows point to each end of a measurement tool. The yellow box indicates a measurement of 102nm. Divide 102 by 60 to get the the number of nautical miles in 1°. In the example, there are 1.7° between the two isobars, falling between two table columns. 40° latitude at 1.5 isobars/degree equals 33 kts winds. 2.0 isobars/degree equals 25 kts. 30 kts is a reasonable estimate of winds in the area. Estimated Wind Direction Estimate wind direction by looking at the direction of the isobars. Wind blows out of the high by 15° to 30° and into the low by the same. Interestingly, in both cases, subtract 15° to 30° from the direction of travel of the isobar for an estimate of wind direction. Estimate wind direction in the example by taking the angle of the measurement (325°) and subtracting 90°. Resulting in the direction the isobar is coming from (235°). The wind travels into the low by an angle of 15° to 30°. Resulting in an estimated wind direction of 205° to 220°.
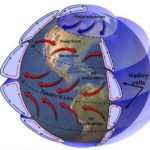 An Island in the sun Back to our island in the sun image. Although not apparent in the image, the rays of the sun do not directly heat the atmosphere. Instead, the sun’s rays heat the land, which in turn heats the air. It’s clear from this small-scale model the sun is the driving force behind the movement of air in this case. But, how about on a larger, global scale. Is the sun still the motivating factor? Yes! Hadley Cells The more directly the rays of the sun impact the Earth, the more energy is transferred, heating the Earth and the atmosphere above it. The sun is located more or less over the equator (more on that later.) The portion of the Earth’s surface near the equator is heated more causing it to rise vertically. Image by NASA Hadley cells are the basis for our understanding of global-scale meteorology. The heated air from the equator begins to move toward the poles and to cool. As the air cools, it begins to descend back to the Earth’s surface. The cooling air descends about latitude 30, causing a “pile” of extra air to end up at that location. This is referred to as an area of high pressure. As the cooled air reaches the Earth’s surface it heads back to the equator. All the while, the Earth is spinning beneath the atmosphere, resulting in wind moving in a more or less Northeast to Southwest direction (in the Northern Hemisphere). These winds are referred to as the Trade Winds. Known as a Hadley cell this movement of air forms a convection cell that dominates tropical and sub-tropical climates in the lower latitudes (0 to 30 degrees). Ferrel Cells Ferrel Cells are an atmospheric circulation cell occupying the mid latitudes (30 to 60 degrees). In this cell the air flows poleward and toward the east near the surface and toward the equator and westward at higher levels., rising around 60 degrees and descending around 30 degrees. Polar Cells With a Polar cell, the air rises from around latitude 60 and travels toward the poles. Once over the poles, it sinks, forming the polar highs. At the surface air diverges out and away from the pole. Surface winds blow from the east (polar easterlies). Global Wind Belts There are three global wind belts north, and three south of the equator. As mentioned earlier, located close to the equator are the Trade Winds (also known as the Tropical Easterlies), blowing from east to west. Located from around 30° to 60°are the Prevailing Westerlies coming out of the west. Finally, north and south of 60° are the Polar Easterlies. Bands of High and Low Pressure Between the Hadley cells and the Ferrel Cells is a band of high pressure at the surface. The high-pressure band is located about 30° North and 30° South latitude. There is also a high pressure area at each pole. Low pressure bands are found at the equator and 50° to 60° North and South latitude Hot and dry weather is associated with high pressure. Rainy and stormy weather is associated with low pressure. The region between 50° and 60° latitude (north and south) tends to have more precipitation due to more storms moving around the earth at these latitudes, especially along the west coast of continents. Many of the Earth’s desert areas are located along latitude 30°, and large high pressure areas are found there in the middle of oceans. Seasonal Changes Due to the tilt of the Earth, the sun is directly over the equator only twice a year, on about March 20th and September 22nd. During the summer and winter, the sun slowly “moves” north and south of the equator to a maximum of 23.44° north on about June 21, and 23.44° south on about December 21 . The maximum latitude marking the sun’s location is known as the Tropic of Cancer in the north, and the Tropic of Capricorn in the south. The tropics lie between the Tropic of Cancer and the Tropic of Capricorn. North and south of that are the temperate zones. As the sun moves, the Hadley Cells, Ferrel Cells, and their associated high and low pressure systems also move. The perfect example is the semi-permanent North Pacific High. Center about latitude 30, the North Pacific High moves north in the summer to roughly 38°. Air Masses One final topic to introduce is air masses. An air mass is a volume of air covering hundreds or even thousands of square miles. It’s defined by its temperature and water vapor content, and falls into one of five types. Understanding air mass types becomes important later on when we discuss fronts. Maritime Tropical (mT) air masses form over warm water areas of the tropics, and consist of warm moist air. When you think of Maritime Tropical, think hot and humid. As the name suggests, Maritime Polar (mP) air masses form over cooler marine environments, and are responsible for cloudy damp weather. Continental Tropical (cT) Continental tropical air masses are hot and dry. They usually form over a desert area during summer. Continental Polar (cP) consists of cold and dry air. These often dominate the weather picture across the USA during winter. These air masses are the ones responsible for bringing clear and pleasant weather during the summer to the north. Except in rare circumstances, a Continental Arctic (cA) air mass is not of concern to the typical sailor. An Arctic air mass is identified by extremely cold temperatures and very little moisture. These usually originate north of the Arctic Circle, however during winter may plunge south.
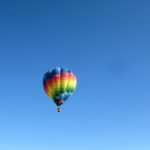 Knowledge of the weather is as crucial to today’s sailor as it was two hundred years ago. Fortunately, advances in technology have put weather forecasting capabilities within the grasp of the average sailor, who with the click of just a few buttons can bring up surface analysis maps which draw on the talents of some of the world’s most knowledgeable meteorologists. With analysis in hand, and a relatively small degree of knowledge, every sailor is better prepared to face conditions at sea. I am not a trained meteorologist. I’m simply a sailor who found a need to learn a little about the weather. A first glance at a surface analysis contains a vast array of confusing symbols and colors. It must require nothing short of genius to interpret. Fortunately, that couldn’t be further from the truth. With a short amount of study, the isobars, high-pressure and low-pressure areas, cold and warm fronts, troughs, and ship reports begin to jump off the page to explain why it’s raining right now. Or, you can expect stormy conditions tomorrow. Therefore, it is a good day to stay at home by the fire. So, enjoy a good book and excellent company. What is the most important aspect to know about the weather? Ask this question of five sailors in a bar, and you will likely get six different answers, mostly focused on storms. Not true. Knowing the wind is the number one factor a sailor can know. Will there be too much or too little? Interestingly, too little is more often the case, and part of the task of a good navigator is to plan the route that offer the best wind for the sailing destination in mind. Whether that destination is a day sail on San Francisco Bay, or a Pacific Puddle Jump from Mexico to French Polynesia, understanding where the wind is, and effects of land and latitude go a long way to making the voyage safe and enjoyable. My goal with this website is to aid you in becoming a knowledgeable navigator. Each article is designed to further your education. In effect, it is an online training class composed of blog posts, videos, and practice exercises. Each post is topical. In chronological order, we explore weather beginning on a global scale. Going from high level to a detailed view, we look at all aspects of weather, right down to local effects. For example; why does wind typically blow from the Northwest along the central coast of California? However, why does it suddenly change to a Southwest wind in San Francisco Bay? How is that same wind is impacted by Alcatraz Island sitting the middle of the bay. All weather is based on the relationship of the Sun to the Earth. Warm air rises. Cool air sinks. The Earth “rotates under the Sun.” Driving all of the weather patterns we experience. Let’s start our weather education with a simple drawing of a large scale process scaled down to size. An Island in the Sun A great deal of information is found in this simple image. Some of it is obvious, and some not. The sun heats everything, however, land heats faster than water. Warm air rises. In this case, the “packet” of air directly above the island moves upward. Warm air is able to hold more moisture than cooler air. Wind is the movement of air from one place to another. As the packet of warm air rises, it begins to cool back down. When the packet of air cools to a certain point (called the dew point) it condenses into clouds. At some point, the cooling air begins to move away from the newly arriving warmer air. The cooled air begin to sinks, replacing the cool air moving toward the island. The rising warmer air over the land creates an area of lower pressure (less air). The sinking cool air creates an area of high pressure (more air). Here’s another visual for you. The packet of air above the island is like a hot air balloon. As the air inside warms, the balloon rises. Just like the air in the balloon the packet of air rises as a unit. Warming, rising, condensing, and moving away from the source of the heat more or less as a single unit. That’s enough for now. In the next post, we look at the same process on a global scale.
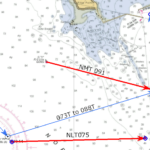 This navigation exercise requires Chart no. 18645 – Gulf of the Farallones Parallel rule Calculator Pencil Exercise 1 It is June 4, 2020 and you are headed to Pillar Point for the weekend. Slack before flood is at 0724, so you time your arrival at the bridge for 0730. You arrive at R”8” (37° 46.55′ N, 122° 35.18′ W) in the Main Ship Channel at 0830 and turn to 180 (166M). There is fog along the coastline and you can’t see any landmarks or nav aids. Your vessel speed is 6 knots. First, Plot your DR ahead for the next 2 hours (1030). The fog has cleared enough at 0951 to take a bearing of Pt San Pedro Rock. It is 122M and is 045 degrees relative off the port bow. What is your DR Lat and Lon? Use the bearing to determine your estimated position. What is the EP Lat and Lon? Exercise 2 Continuing on your trip, at 1018 Pt San Pedro Rock bears 090 relative. Hint: Forget the EP. Continue with the DR plot. What is your distance off? Using distance off LOP and the bearing LOP to Pt San Pedro Rock to get a fix. What is your Lat and Lon? Advance the 0951 bearing to Pt San Pedro Rock forward to 1018. What does this do to your fix? Exercise 3 Continuing on your course of 180T, you plan to turn towards the Pillar Point approach buoy (RW “PP” (37° 28.35′ N 122° 30.83′ W) when abeam of R “26” (37° 32.17’ N, 122° 33.09 W). What is the ETA to the turn? How far away from R “26” are you set to pass? What is the bearing (M) to the Pillar Point radar tower when you make your turn abeam R”26″? What course will you turn to head for RW “PP” (37° 28.35′ N 122° 30.83′ W)? What is your ETA at RW “PP”? Exercise 4 Continue on a course to take you into Pillar Point Harbor. Set up two danger bearings to guide you between the two reefs. Danger bearing 1 i a line from G”1″ to G”3″. Danger bearing 2 is a line from PP to R”2″. In degrees magnetic, what are the two danger bearings? Remember to label NMT or NLT. What course would you follow from your turn near PP to travel through the channel? Once clear of the channel, what course would take you to the entrance of Pillar Point Harbor?
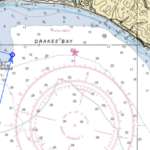 You just finished a wonderful dinner and are back on the boat. It’s Thursday evening, and decision time. Do you return home or head up to Drakes Bay for a day or two. Time isn’t an issue. You don’t have to be back until Sunday, or even later if you want. Weather forecast for the next three days. What is your decision? Motor Back Home Motor Directly to Drakes Bay Sail to Drakes Bay Via the Farallon Islands? So, you chose Sail to Drakes Bay via the Farallon Islands Personally, I think you made the best choice. Leaving Pillar Point Harbor, you head to PP, the Pillar Point Approach Buoy where you raise your sails. Wind is from the NW (315 T). Assume your boat is able to sail to 45 degrees off the true wind, and that your speed will be 5 kts. What is the heading of a direct line from “PP” to the Farallon Light? What is your initial heading under sail? What heading will you tack to? Let’s assume you stay on your initial heading for 3 hours (at 5 kts) before tacking. What is your DR lat and long when you make your first tack. Sunrise is 0547 on June 5 . Sunset is 2029. Assume it takes 45 minutes from your slip to “PP.” If you are able to maintain 5 kts all day, what is the latest time you would need to leave your slip in order to reach your anchorage at 38°00.0′ N; 122°58.5′ W in Drakes Bay before sunset? Plan to go around the west side of Southeast Farallon Island then between Southeast Farallon and Middle Farallon towards Drakes Bay. Answers: No peaking until after you have done the work. What is the heading of a direct line from PP to the Farallon Light? 300 T What is your initial heading? 270 T What heading will you tack to? 360 T Let’s assume you stay on your initial heading for 3 hours (at 5 kts) before tacking. What is your DR lat and long (to the nearest 0.1′) when you make your first tack. 37°28.4′ N; 122°49.7′ W Sunrise is 0547 on June 5 . Sunset is 2029. Assume it takes 45 minutes from your slip to PP. If you are able to maintain 5 kts all day, what is the latest time you would need to leave your slip in order to reach your anchorage at 38°00.0′ N; 122°58.5′ W in Drakes Bay before sunset? Plan to go around the west side of Southeast Farallon Island then between Southeast Farallon and Middle Farallon towards Drakes Bay. 0803 Assuming you leave your slip at 0615 and it takes 45 minutes to reach PP, what is your ETA at the southern traffic lane? How long will it take to cross the lanes? At 1425, you take a bearing of Farallon Lt. bears 004 M, and your depth sounder reads 180 feet. What is your Lat and Long? What course should you steer to put you back on course to round the “back” side of Southeast Farallon? At 1451, you get a bearing of 093M to Farallon Lt. Use the 1425 bearing and the 1451 bearing to get a running fix. What is the Lat and Lon? Answers: No peaking until after you have done the work. Assuming you leave your slip at 0615 and it takes 45 minutes to reach PP, what is your ETA at the southern traffic lane? 0819 How long will it take to cross the lanes? 49 minutes At 1425, you take a bearing of Farallon Lt. bears 004 M, and your depth sounder reads 180 feet. What is your Lat and Long? 37°40.6′ N; 123°00.7′ W What course should you steer to put you back on course to round the “back” side of Southeast Farallon? 325T to 335T At 1451, you get a bearing of 093M to Farallon Lt. Use the 1425 bearing and the 1451 bearing to get a running fix. What is the Lat and Lon? 37°42.4′ N; 123°02.1′ W
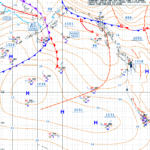 What is Wind The title of this topic might have been “What causes the wind.” Quite simply, wind is moving air. Air doesn’t seem like much, however, it has weight and it has substance, and is actually considered a fluid. This becomes apparent when air moves. While moving, you can see many of the same characteristics you might find in a river. Things like moving as a “unit,” parting and coming back together as it flows around an obstacle, and eddies or back-flows. Air moves from an area of higher pressure into an area of lower pressure. The closer together the high and low pressure is and the greater the difference in pressure, the faster the air flows. Air has weight The temptation is to believe air has no weight, which isn’t true. Logically, it must have weight. If not, you wouldn’t be able to feel the wind on your face while sailing, and your sails would hang limp even in a fresh breeze. If you weigh the column of air directly above you, it would weigh approximately 14.696 pounds per square inch. This is also known as the standard atmospheric pressure. As the graphic demonstrates, there are a number of labels to use when expressing standard pressure. All represent the same value. In the maritime world, millibars (mb) are used. Standard pressure in millibars is 1013.25(mb). Throughout these lessons, we will be using millibars to express atmospheric pressure, however, you may have occasion to check weather briefings and forecasts that use other units of measurement. For example, aviation forecasts typically use inches of Mercury (Hg), where standard pressure is 29.9212 inches (Hg). Atmospheric pressure is also known as barometric pressure. In the Island in the Sun analogy in An Introduction to Marine Weather, heated air ascended traveling away from where it rose where it was added to the “pile” of air at another location, creating a higher pressure. There are other ways in increase atmospheric pressure in a given area. For example, cold air is heavier the warm air. Moisture laden air is heavier than dry air. Consequently, all of these factors are added together to determine pressure in a given area. High Pressure vs. Low Pressure Relatively small variations in pressure determine the wind and storm patterns around the world. The highest pressure every recorded was 1083.98 mb at a location in Siberia. Whereas the lowest, 877.07, occurred in the eye of a South Pacific typhoon. In contrast, most readings fall between 975 mb and 1050 mb, a pressure difference that can easily result in wind speeds in excess of 50 kts! Pressure gradient Pressure gradient is the change in pressure measured across a given distance. Air flows from the high to the low because the pressure gradient creates a net force that starts the movement of air. The greater the pressure change over a given distance the greater the net force. Coriolis Effect Air moves from higher pressure into lower pressure, however, not in a straight line as demonstrated above. Instead, something called the Coriolis Effect causes the air to deflect to the right around the high pressure area. The Coriolis Effect describes the bending of the trajectory of an object as it travels. In the Northern Hemisphere, air that is moving out of a high pressure system towards an area of lower pressure bends to the right. Clockwise Around the High Here’s some good news. Unless you are a scientist or a mathematician, it really doesn’t matter to weather forecasting? Just remember, in the northern hemisphere high pressure systems rotate clockwise and low pressure systems rotate counter clockwise. The wind travels slightly out of the highs and slightly into the lows. The opposite is true in the southern hemisphere. Around and Out We now know the net force resulting from the pressure gradient gets the air moving out of the high, towards the low. Once moving, the Coriolis Effect begins to turn the moving air to the right. The air continues deflecting to the right until the net force of the pressure gradient and the turning force of the Coriolis Effect balance each other out. As a result, the air flows clockwise around and out of the high by 15° to 30°. Isobars Isobars are the contour lines of atmospheric pressure. They are a series of lines on a map connecting points having the same atmospheric pressure. Each isobar is labeled with its represented pressure, generally with a four millibar spacing. In this surface analysis forecast example, a high pressure area can be seen on the left side of the image, slightly below center at latitude 40N. The “H” indicates the center of the high. The expected high pressure there is 1034mb. It’s important to note the “1034” label is underlined, and is not found at the actually location of the highest pressure. In this case, it is slightly above and to the right. The first isobar out from the “H” is 1032mb and includes just the last two digits of the pressure (32). Each successive isobar is 4mb less than the one before; 28, 24, 20, etc. Moving to the upper right on the map, is a low pressure area with an atmospheric pressure of 999 in the position of the X next to the “L”. Although not marked, the small circle surrounding the “Lx” represents a pressure of 1000 isobars. Take a moment to locate and identify the pressure for each isobar between the areas of high pressure and low pressure.