High & Low Pressure Systems
What is Wind
The title of this topic might have been “What causes the wind.” Quite simply, wind is moving air. Air doesn’t seem like much, however, it has weight and it has substance, and is actually considered a fluid. This becomes apparent when air moves. While moving, you can see many of the same characteristics you might find in a river. Things like moving as a “unit,” parting and coming back together as it flows around an obstacle, and eddies or back-flows.
Air moves from an area of higher pressure into an area of lower pressure. The closer together the high and low pressure is and the greater the difference in pressure, the faster the air flows.
Air has weight
The temptation is to believe air has no weight, which isn’t true. Logically, it must have weight. If not, you wouldn’t be able to feel the wind on your face while sailing, and your sails would hang limp even in a fresh breeze.
An Interesting Example
On August 16, 1960, Air Force Captain Joseph Kittinger made a high-altitude parachute jump from 102,800 feet (nearly 20 miles high). At that altitude there is so little air pressure, and so few air molecules, that there was no impression of falling. Moving at a speed of 614 mph, Kittinger’s flight suit did not even flap in the “wind” because there was insufficient air molecules and weight to move the fabric.
Standard Atmospheric Pressure
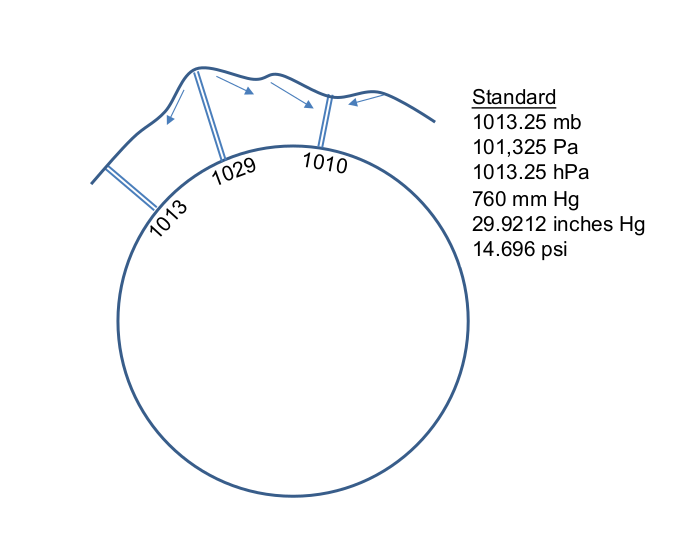
If you weigh the column of air directly above you, it would weigh approximately 14.696 pounds per square inch. This is also known as the standard atmospheric pressure. As the graphic demonstrates, there are a number of labels to use when expressing standard pressure. All represent the same value.
Millibars
In the maritime world, millibars (mb) are used. Standard pressure in millibars is 1013.25(mb). Throughout these lessons, we will be using millibars to express atmospheric pressure, however, you may have occasion to check weather briefings and forecasts that use other units of measurement. For example, aviation forecasts typically use inches of Mercury (Hg), where standard pressure is 29.9212 inches (Hg).
Atmospheric pressure is also known as barometric pressure.
In the Island in the Sun analogy in Convection Cells and Global Weather Patterns, heated air ascended, traveling away from where it rose it was added to the “pile” of air at another location, creating a higher pressure at the new location. There are other ways in increase atmospheric pressure in a given area. For example, cold air is heavier the warm air. Moisture laden air is heavier than dry air. Consequently, all of these factors are added together to determine pressure in a given area.
High Pressure vs. Low Pressure
Relatively small variations in pressure determine the wind and storm patterns around the world. The highest pressure every recorded was 1083.98 mb at a location in Siberia. Whereas the lowest, 877.07, occurred in the eye of a South Pacific typhoon. In contrast, most readings fall between 975 mb and 1050 mb, a pressure difference that can easily result in wind speeds in excess of 50 kts!
Pressure Gradient
Pressure gradient is the change in pressure measured across a given distance. Air flows from the high to the low because the pressure gradient creates a net force that starts the movement of air. The greater the pressure change over a given distance the greater the net force, the greater the air flow.
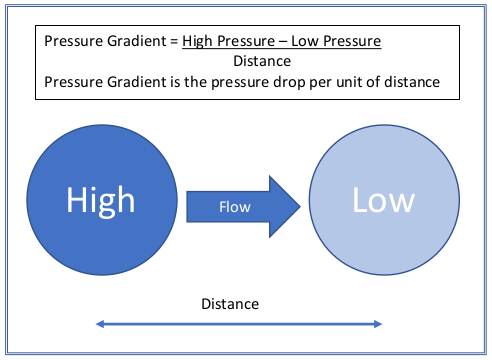
Pressure Gradient 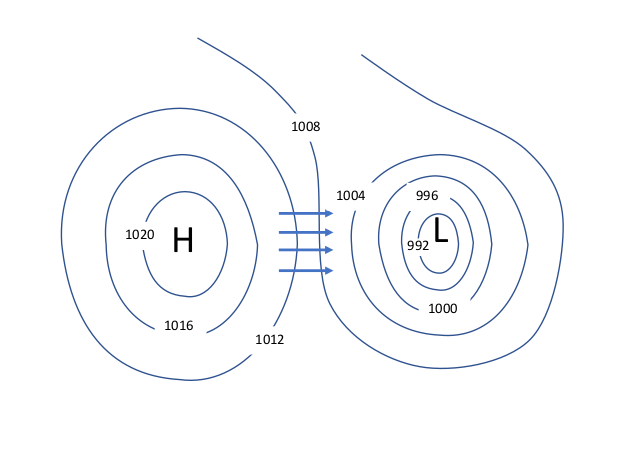
Air moves from high pressure to low pressure.
Coriolis Effect
Air moves from higher pressure into lower pressure, however, not in a straight line as demonstrated above. Instead, something called the Coriolis Effect causes the air to deflect, or turn.
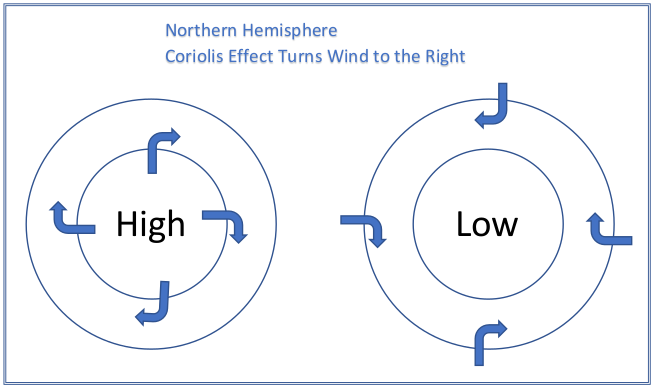
The Coriolis Effect works at 90° to the wind
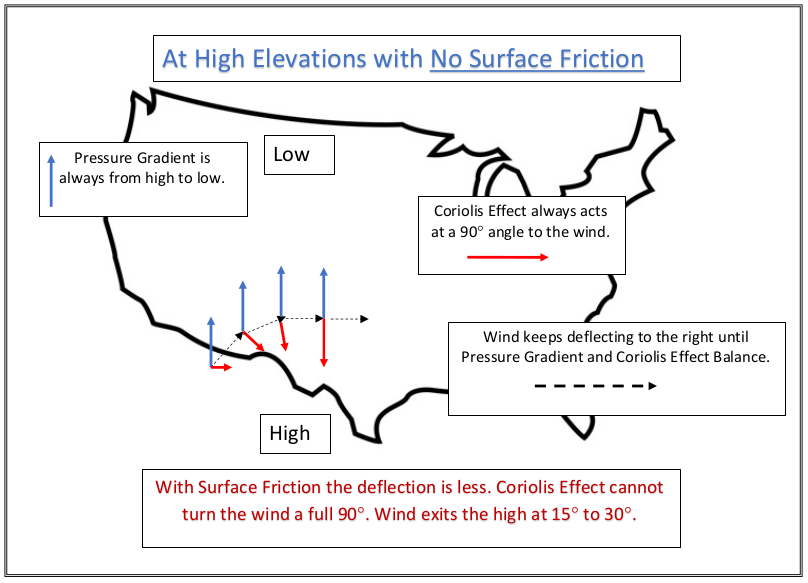
The wind starts in the same direction as the pressure gradient. The Coriolis Effect working at 90° to the right causes the wind to change direction so that it balances the two forces. The Coriolis Effect will now start working at a 90° angle to the new wind, forcing the wind to turn further. Again, the Coriolis Effect works at 90° to the wind, forcing it to turn further. This process continues until the pressure gradient and the Coriolis Effect balance each other out.
The Coriolis Effect describes the bending of the trajectory of an object as it travels. In the Northern Hemisphere, air that is moving out of a high pressure system towards an area of lower pressure bends to the right. In the Southern Hemisphere the effect is the opposite, bending flow to the left.
Wind “starts” in same direction as Pressure Gradient. The Coriolis Effect turns the wind to the right, gradually moving further and further clockwise until the Pressure Gradient and the Coriolis Effect reach equilibrium. At the surface, friction is counted in the equilibrium, resulting the the wind moving out of the high at about 15° to 30° instead of getting parallel to the isobars.
Clockwise Around the High
Here’s some good news. Unless you are a scientist or a mathematician, all the details really doesn’t matter to the typical sailor? Just remember, in the northern hemisphere high pressure systems rotate clockwise and low pressure systems rotate counter clockwise. The wind travels slightly out of the highs and slightly into the lows.
The opposite is true in the southern hemisphere.
Around and Out
We now know the net force resulting from the pressure gradient gets the air moving out of the high, towards the low. Once moving, the Coriolis Effect begins to turn the moving air to the right. The air continues deflecting to the right until the net force of the pressure gradient and the turning force of the Coriolis Effect balance each other out. As a result, the air flows clockwise around and out of the high by 15° to 30°. The same effect causes air entering a low to turn to the right, moving counter-clockwise around the low.
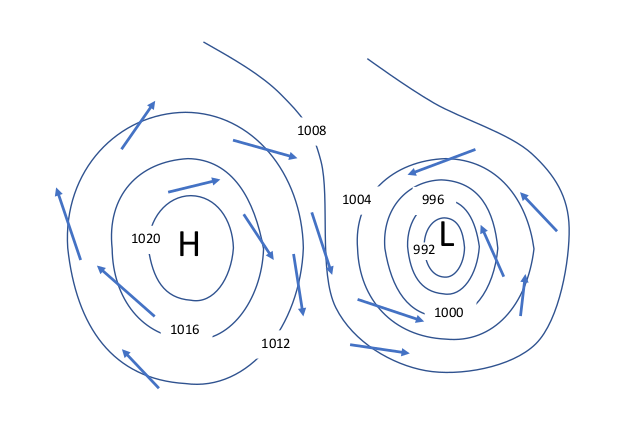
Isobars
Isobars are the contour lines of atmospheric pressure. They are a series of lines on a map connecting points having the same atmospheric pressure. Each isobar is labeled with its represented pressure, generally with a four millibar spacing.
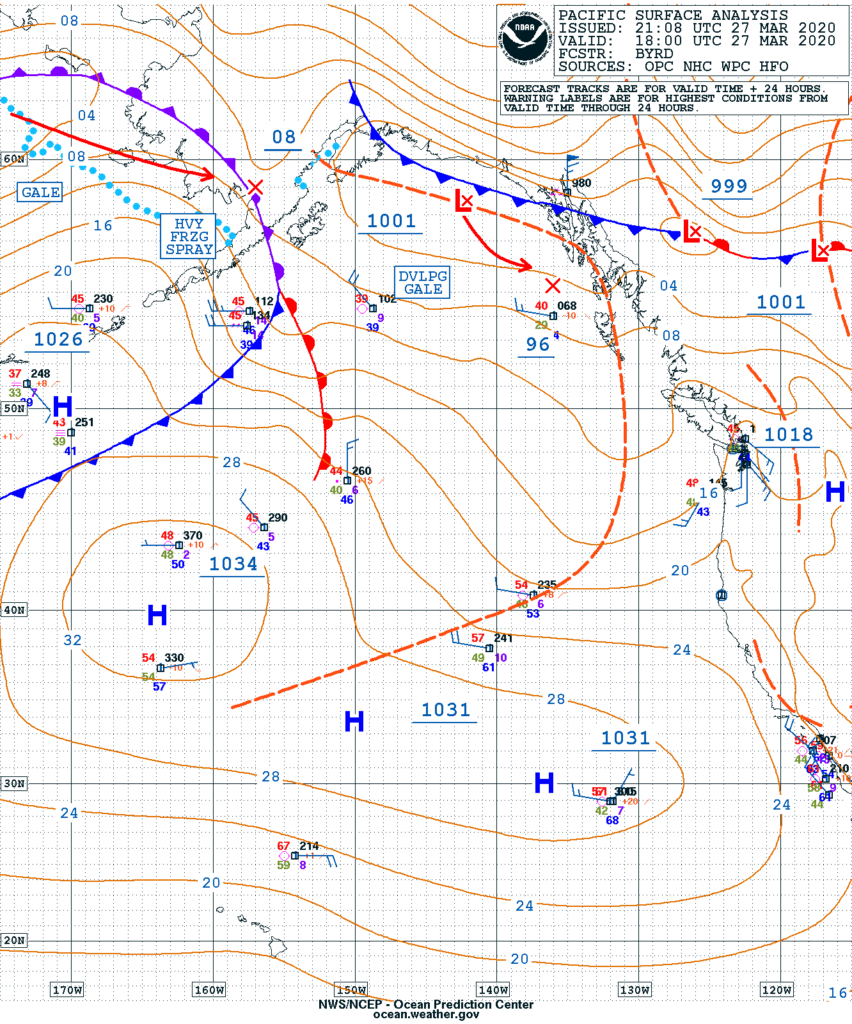
In this surface analysis forecast example, a high pressure area can be seen on the left side of the image, slightly below center at latitude 40N. The “H” indicates the center of the high. The expected high pressure there is 1034mb. It’s important to note the “1034” label is underlined, and is not found at the actually location of the highest pressure. In this case, it is slightly above and to the right. The first isobar out from the “H” is 1032mb and includes just the last two digits of the pressure (32). Each successive isobar is 4mb less than the one before; 28, 24, 20, etc.
Moving to the upper right on the map, is a low pressure area with an atmospheric pressure of 999 in the position of the X next to the “L”. Although not marked, the small circle surrounding the “Lx” represents a pressure of 1000 isobars. Take a moment to locate and identify the pressure for each isobar between the areas of high pressure and low pressure.
Properties of Highs and Lows
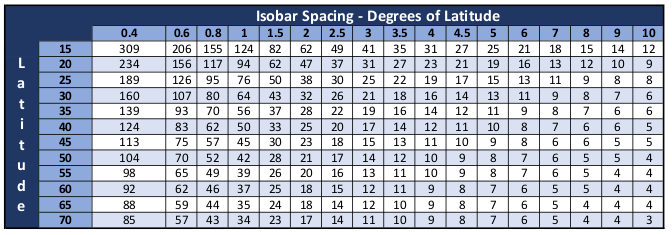
Calculating Wind from Isobars by Table Lookup
There are at least two formulas I know of to estimate wind speed based on spacing of isobars on a surface analysis. Both are based on the relationship between pressure gradient (e.g. millibars per degree) and the latitude of interest. For those that are interested, a discussion of each follows. Fortunately, it is much easier to use a table where someone else has done the math for you.
Calculating Wind Speed
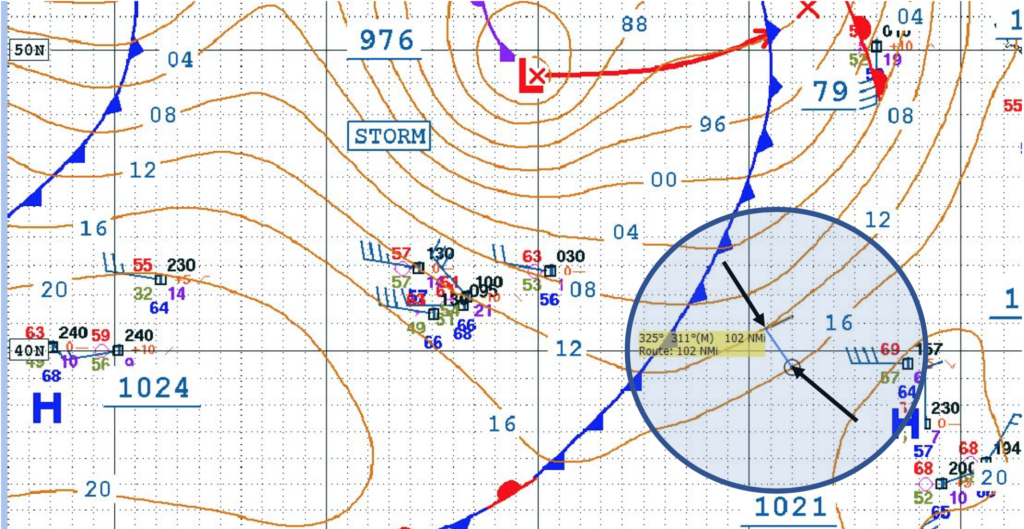
Measurement of the spacing of isobars can be done manually, or with the assistance of a tool. Here, a Surface Analysis of the Northeastern Pacific was loaded and displayed using OpenCPN, a chart plotter program. The shaded circle highlights the area of interest which is located on latitude 40.
The two black arrows point to each end of a measurement tool. The yellow box indicates a measurement of 102nm. Divide 102 by 60 to get the the number of nautical miles in 1°. In the example, there are 1.7° between the two isobars, falling between two table columns. 40° latitude at 1.5 isobars/degree equals 33 kts winds. 2.0 isobars/degree equals 25 kts.
30 kts is a reasonable estimate of winds in the area.
Estimated Wind Direction
Estimate wind direction by looking at the direction of the isobar. Wind blows out of the high by 15° to 30° and into the low by the same. Interestingly, in both cases, subtract 15° to 30° from the direction of travel of the isobar for an estimate of wind direction.
Estimate wind direction in the example by taking the angle of the measurement (325°) and subtracting 90°. Resulting in the direction the isobar is coming from (235°). The wind travels into the low by an angle of 15° to 30°. Resulting in an estimated wind direction of 205° to 220°.
Elevation and adjusting to “sea-level”
As you move higher in the atmosphere, there are fewer air molecules above you. Consequently, there is less weight, meaning less air pressure. Beginning at sea level, the first 1000 feet will result in a pressure change of about 36 mb. As a result, assuming a sea level pressure of 1013.25 mb, someone at 10000 feet would be experiencing only 696.82 mb. It’s easy to see how this presents a problem if displayed that way on a weather map. Owing to this, all air pressure measurements are adjusted to their sea level equivalent before use.
Next: Understanding Wind