Pilot Charts
What Are Pilot Charts?
Pilot Charts provide the navigator with averages. Averages concerning prevailing winds and currents, air and sea temperatures, wave heights, ice, visibility, barometric pressure, and weather conditions.
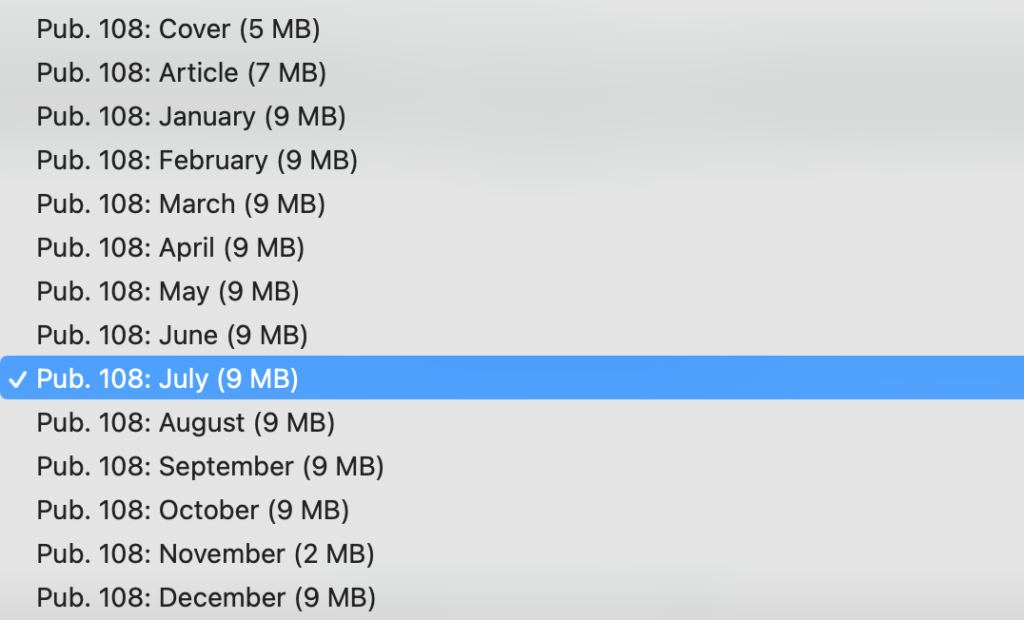
There are five volumes of Pilot Charts, each being its own publication, and each covering a specific geographic region. Each publication is actually a compilation of twelve individual pilot charts, one for each month of the year.
Pilot charts are intended to aid the navigator in selecting the fastest and safest routes with regards to the expected weather and ocean conditions. Pilot Charts are not intended to be used for navigation, however, they are invaluable in planning stages of a voyage.
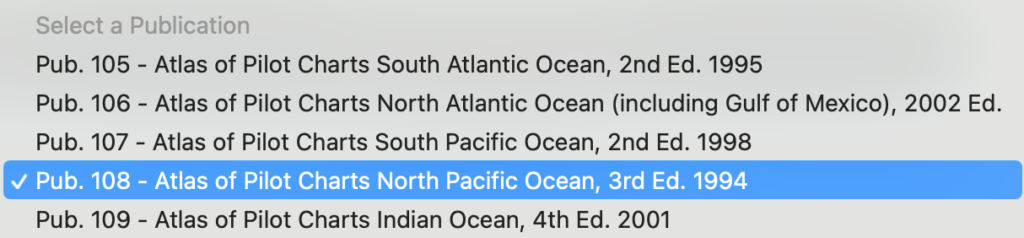
Coverage Areas
Pilot Charts may be downloaded from the Maritime Safety Information Publications website.
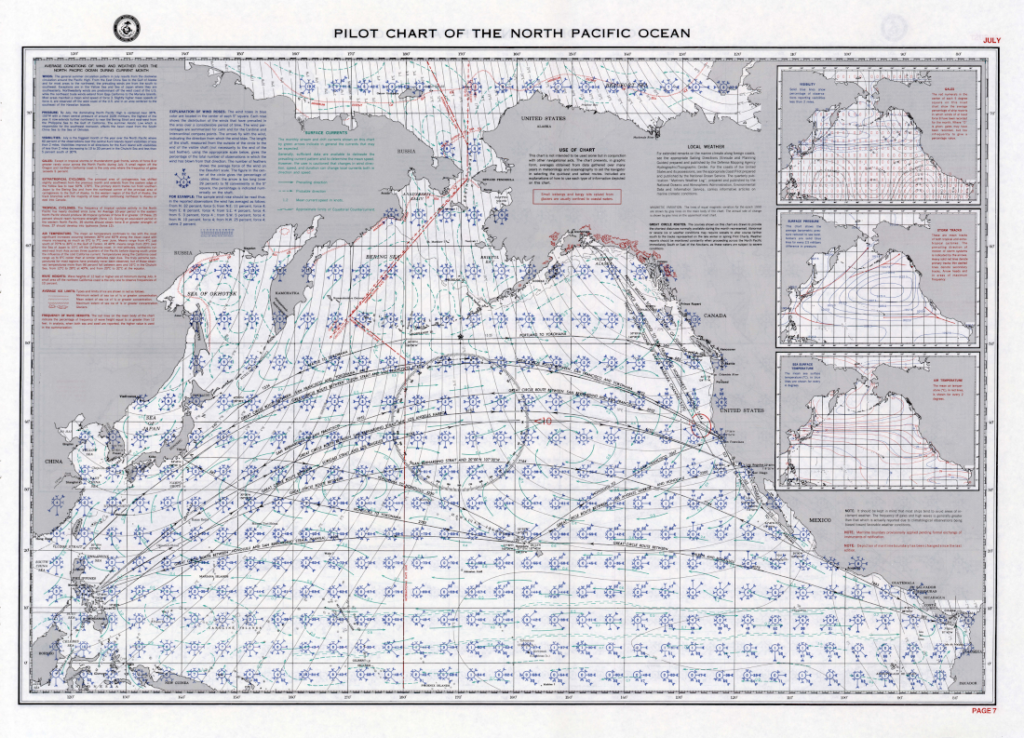
As can be seen in the image below, there is a great deal of information contained in a pilot chart. Most of this information will be explored and interpreted as we move through this post. In this case, we will be looking at average conditions in the North Pacific Ocean in the month of July. One very nice feature of a Pilot Chart is that it not only contains the data, but also instructions on how to use and interpret the data. Pilot Charts are very much self contained.
The Main Body of the Chart
Wind Roses
As a sailor who primarily is interested in wind driven vessels, my primary concern when it comes to sailing is the wind. Will there be enough? Too much? What direction will it be coming from.
Fortunately, typical wind conditions is one of the primary pieces of information found on a pilot chart. Every 5 degrees (300 miles), east and west as well as north and south is a wind rose. Understanding the wind rose is critical to proper use of a pilot chart.
Wind Arrows
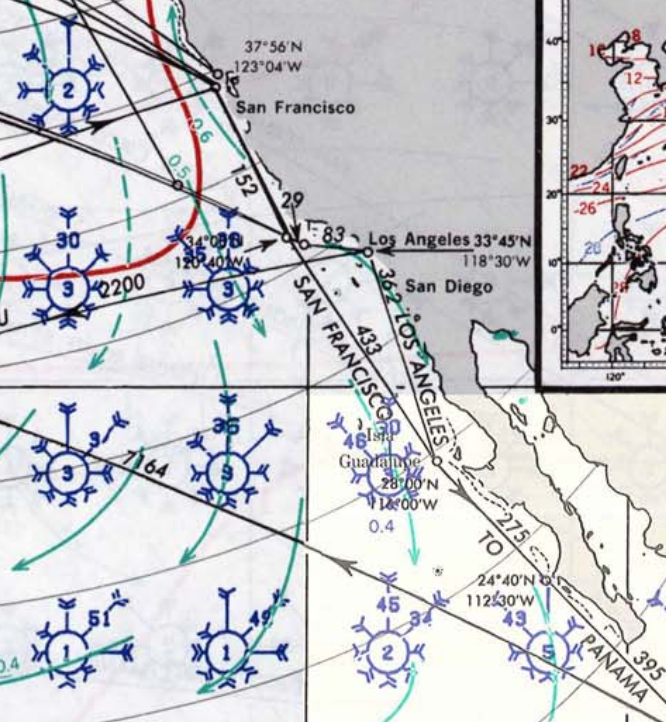
There is a wind rose sitting just offshore from San Francisco. Because of the land mass and printed information on the chart, it can be a challenge to read this rose, but let’s give it a try. We will start by looking at the wind arrows. There are eight of them, marking the cardinal (N,S,E,W) and intercardinal (NW, SW, SE, NE) compass points. The length of the arrow shaft tells you the percentage chance of wind from that direction (more on measuring it in a minute).
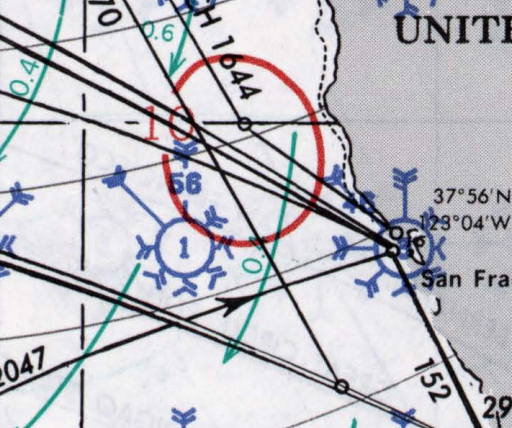
In this case, the arrow coming from the NW has the number 45 printed on it. Any time a wind arrow is “too long”, it is shortened to a set maximum length and the percent chance of wind from that direction is printed.
Also included as part of the wind arrow are “feathers” arranged on each side of the shaft. There are four arrows, two on each side. The arrows indicated the Beaufort force of the wind coming from the indicated direction. That one arrow now tells us there is a 45% chance of force 4 winds (11-16 knots) coming from the northwest.
The length of the arrows not labeled with percentages can be measured and compared with a scale found on the chart. A quick measurement with dividers provided an 18% change of wind from the north at force 5 (17 to 21 knots).
Calm Days
The final item relating to the wind rose is the number within the circle at the center. In this case, “8”. There is an 8% chance of a calm day (less than 1 knot of wind).
Wave Heights
Before we move to the next graphic, the is one more piece of information found in the graphic above. The red solid line indicates the percentage change of 12 foot or greater waves during the month. Directly off of San Francisco, it is statistically rare, but it may happen. However, a bit to the north there is a 10% chance of 12′ or greater waves.
San Francisco to Cabo San Lucas in November
Before we move on to the next topic, here is a quick planning exercise for an imaginary trip from San Francisco to Cabo in November.
Off of San Francisco, about 40% of the time the wind will be out of the N or NW at force 4, with calm days expected only 2% of the time. Waves of 12 feet or greater are expected 10% of the time.
Near Los Angeles, the wind will be out of the N or NW at force 4 about 76% of the time.
Nearing Cabo, the prevailing winds are still out of the N or NW over 70% of the time, however, the intensity has dropped to force 1 (1 to 3 knots)
Surface Currents
A new piece of information contained on the chart also presents itself in this exercise. The green arrows represent the expected current in the area. Mostly going down the coast on this trip, currents of .4 to .5 knots will help you on your way. However, if you look close, near shore north and south of San Francisco is a counter current heading north at .6 knots. Staying close to shore could add an extra 4 hours to your trip during the first 200 or so miles.
Two additional topics covered in the main body of the Pilot Chart that may not be of general interest to most sailors are the limits of ice during the month, and a plot of great circle routes (including distance) between a number of major ports. It is nice to know where they are, and the distance from place to place. San Francisco to Yokohama is 4452 and is composed of an arc starting at the 38th parallel, then traveling as high as the 48th parallel before dropping back down to latitude 35.
Average Weather Conditions
In the upper left of the chart is a general text description of the average conditions of wind and weather. Topics covered include:
- Winds
- Pressures
- Visibilities
- Gales
- Extratropical Cyclones
- Tropical Cyclones
- Air Temperature
- Wave Heights
- Average Ice Limits
- Frequency of Wave Heights
Sub Charts
In Addition, graphics of the topics shown above are included.

reduced visibility and gale force winds.
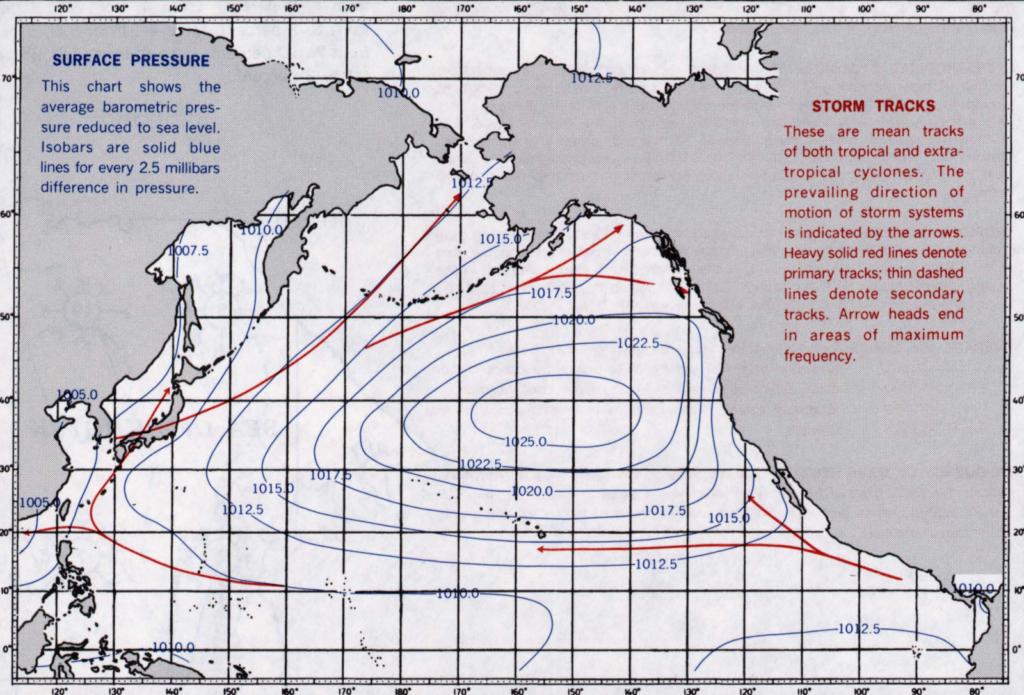
pressure systems. In this case, the North Pacific High.
Air and Sea Temperature
A sub chart is included (not shown) indicating average air and sea temperatures in the area for the depicted month.
Ice Limits
Great Circle Routes