Coastal Navigation requires the use of tools. Maybe not the type of tools you visualize when you think of tools, however, they are still tools.
Without pencils, erasers, charts, tide tables and a way to draw lines on a chart it would be impossible to know where you are going, much less where you currently are.
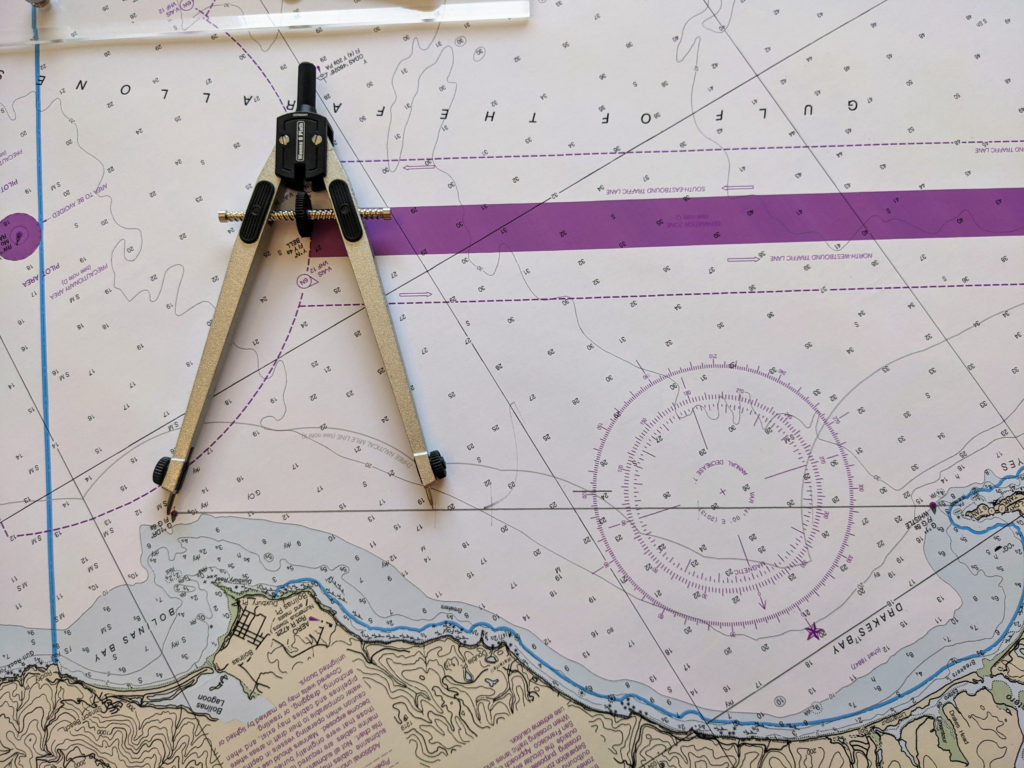
Traditional Tools of a Navigator
There aare a few basic publications, such as a chart of the area, tide/current tables and Local Notices to Mariners which should always be carried.
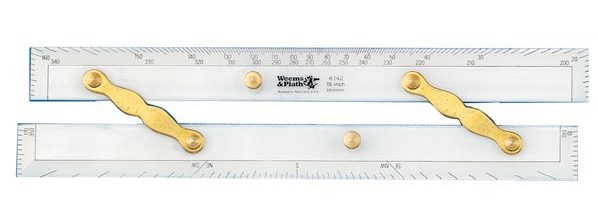
Dividers and some type of plotting tool(s), which is simply a device that allows you to find or draw courses, lines, and parallel lines.
A hand held compass is required. Also highly recommended is a mounted ships compass.
Of course, miscellaneous tools like pens, pencils, eraser, calculator, an accurate watch and some means of judging speed are essential.
Electronic Technology
Today’s technology driven world provides us with a number of electronic devices that make a navigator’s job much easier. Some navigators don’t consider technology to be a part of traditional piloting. Other dismiss traditional methods in favor of technology.
Both type of navigators are making a mistake. Radar, GPS, and chart plotters are tools that should be used! However, they should be used as part of the navigation process, not the entire process.
Information on electronic navigation tools and techniques will be covered later.
In November of 2019, NOAA announced that they would be “Sun setting” traditional production of all raster chart products. In other words, production of traditional NOAA paper charts and all raster products will be completely ceased by January 2025.
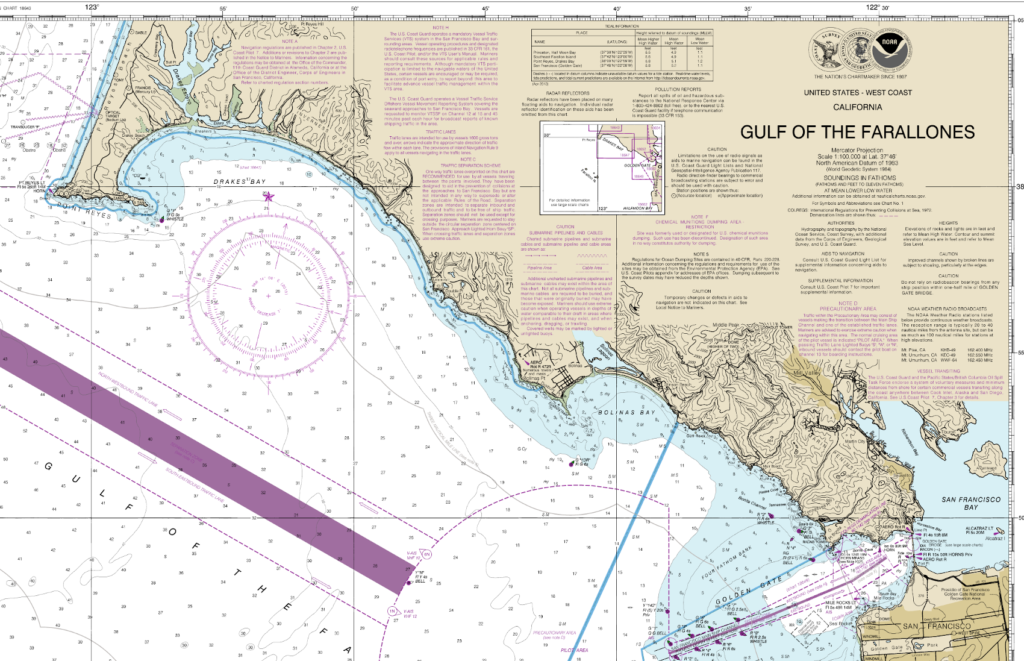
Since that time, NOAA has been slowly and surely moving toward that goal. For example, support for the Lake Tahoe Chart (18665) ended on August 26, 2021, the Gulf of the Farallones (18645) cancelled October 5, 2022, and the Entrance to San Francisco Bay (18649) cancelled on July 31, 2024. The last of the raster chart products was cancelled in December of 2024.
Raster vs Vector (ENC) charts
I am probably not the best person to discuss the difference between raster and vector charts, however, in simplified terms, with a raster chart you get what you see. All the pixels are drawn and set in place as part of the file. Zooming in gets you a closer visual, but does not reveal any additional data.
Vector charts are digital data, storing “features” as pairs of latitude and longitude coordinates. Records associated with each feature provide detailed information, such as the feature’s color, shape, purpose, quality of position, and other attributes.
With vector charts you can zoom in or out of the file image. As you do so, more or less detail is uncovered. For example, on one zoom setting you may see where a line of lateral marks lining a channel is located. Zooming in one more step may reveal charted depths in addition to the mark locations.
ENC Chart Numbering
At first glance, the numbering system used for the new vector charts is mind numbing. Fortunately, with a little understanding of the system it makes perfect sense! Each ENC chart (or cell) is given a unique 8 digit identifier following strict international guidelines.
An example of an ENC cell name is US4CA11M. The first two digits (US) indicate the producer of the chart, in this case, the United States.
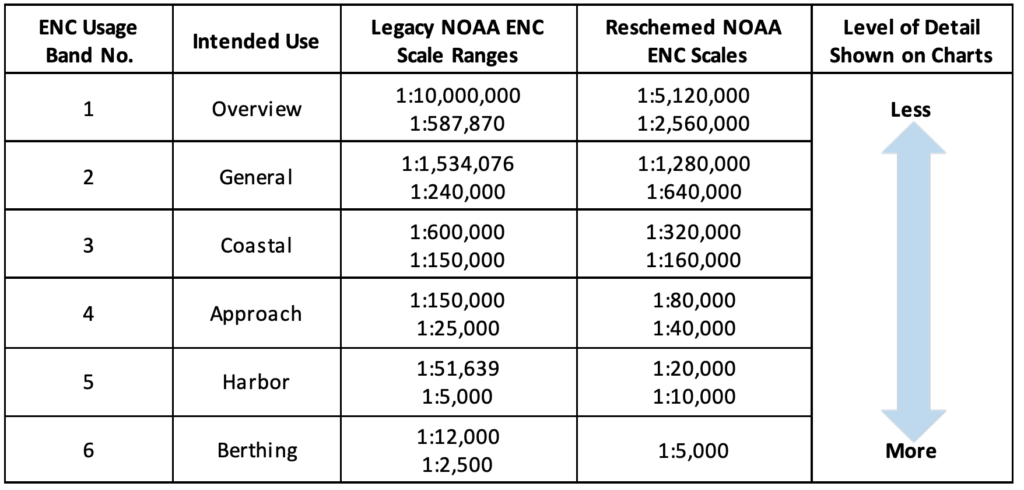
The third digit is a number from 1 to 6 that identifies the navigational purpose of the cell. ENC cells identified by the number 1 show the largest area with the least detail. As the number increases, the size of the area covered decreases while the detail increases.
“The Chart Number”
The next 5 digits are a unique alpha numeric identifier, much like the old chart identifier system. However, each producer has the ability to design the layout of this number to fit its needs. In the United States, cells will include an “area reference” as the 4th and 5th digits.
The 6th and 7th digits are a cell sequence number similar to chart 1, 2, 3, 4, etc., typically in order of creation.
The final digit is generally a letter. In most cases the letter is M, however not always, and I have not been able to find a legend of what the various final digits mean. One source I found says the “M” means the soundings are stored in the file in meters, even though they may be printed in other configurations.
The 4th and 5th “area reference” digits for a purpose 1 or 2 cell will have an identifier like WC for west coast or EC for east coast. Purpose codes 3 through 6 have an area reference identifier more specific to the area the cell covers. For example, CA, OR, or AK.
The cell example above, US4CA11M, indicates it is a US chart, with an approach purpose (scale between 1:150,000 and 1:25,000. It covers California waters, and is the 11th in the sequence.
Viewing ENCs
Unfortunately, it isn’t the purpose of this tip to explain how to use ENCs. However, it’s important to know that in order to view an electronic chart, you must have some type of electronic chart viewer. I know, that statement is so simple as to seem pretty dumb to say. But, it is true.
There are a number of electronic chart viewers available to you. The only one I have any experience with is OpenCPN which is a full navigation program, capable of downloading and displaying Raster and ENC charts on windows, mac, and various linux based systems.
Knowing the value of printed charts, NOAA created a tool where PDF files can be created using data from ENC charts that are very similar in look and function to the “old fashioned” raster charts. Smaller charts (e.g. 8.5″ x 11″) can be printed using a home printer. Larger charts (up to 42″ x 60″) can be printed using the services of a professional office printing company.
Having experimented with the charttools product since it’s rollout, I personally find it to be very handy. During a recent Advanced Coastal Cruising class I produced and printed a chart book containing all of our cruising area on 11 x 17 paper. Students in the class had no issues with using the format, and found the size much more convenient than tradition raster chart products.
There may be times when a navigation chart showing contours along the coast and/or navigational hazards is not needed. This is generally the case with celestial navigation, however, you may also find times while piloting along a coast that this is the case. An example might be that you prefer to keep your DR and Fix plotting off of the navigation chart in order to keep it more readable. Using a Universal Plotting Sheet allows you this flexibility.
Universal Plotting Sheets may be purchased in pads of 50, or they may be downloaded from the internet. Generally, they will include a compass rose in the center, three pre-drawn latitude lines, and one centrally located line of longitude. They are printed with “minute” marks (miles) for latitude and a scale to use in determining minutes of longitude. Having a pad on board is always a good idea.
Unfortunately, having a pad on board is not always the case, and “using the up” during practice can be expensive and frustrating. Fortunately, there is another solution. You can use any conveniently sized paper (e.g. 8.5 x 11) to make your own. I personally like to just use a blank notebook as a navigation log, and use a blank page in it to create universal charts as needed. Here is how.
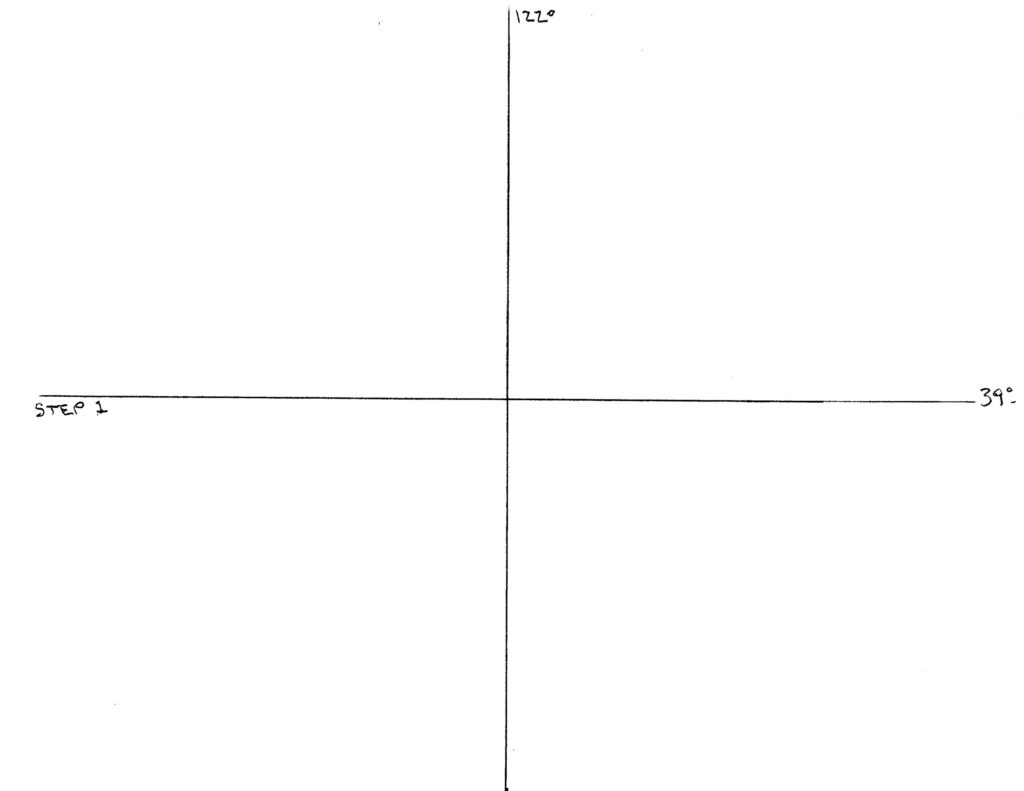
Plot The Primary Latitude and Longitude Lines
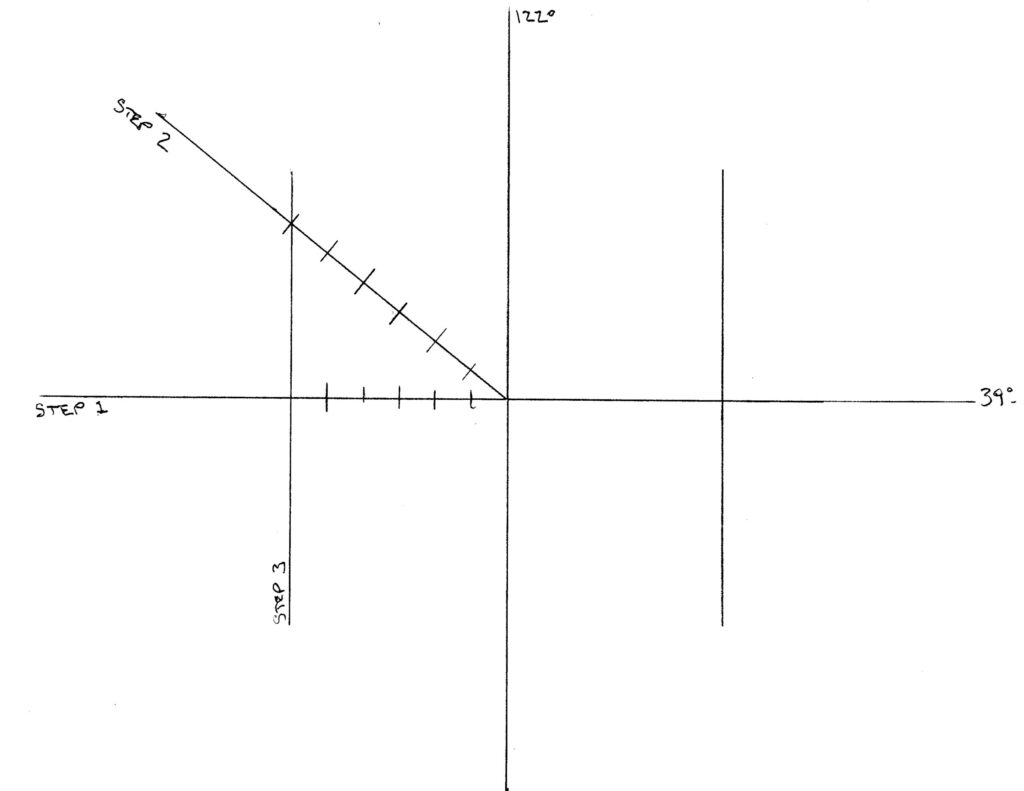
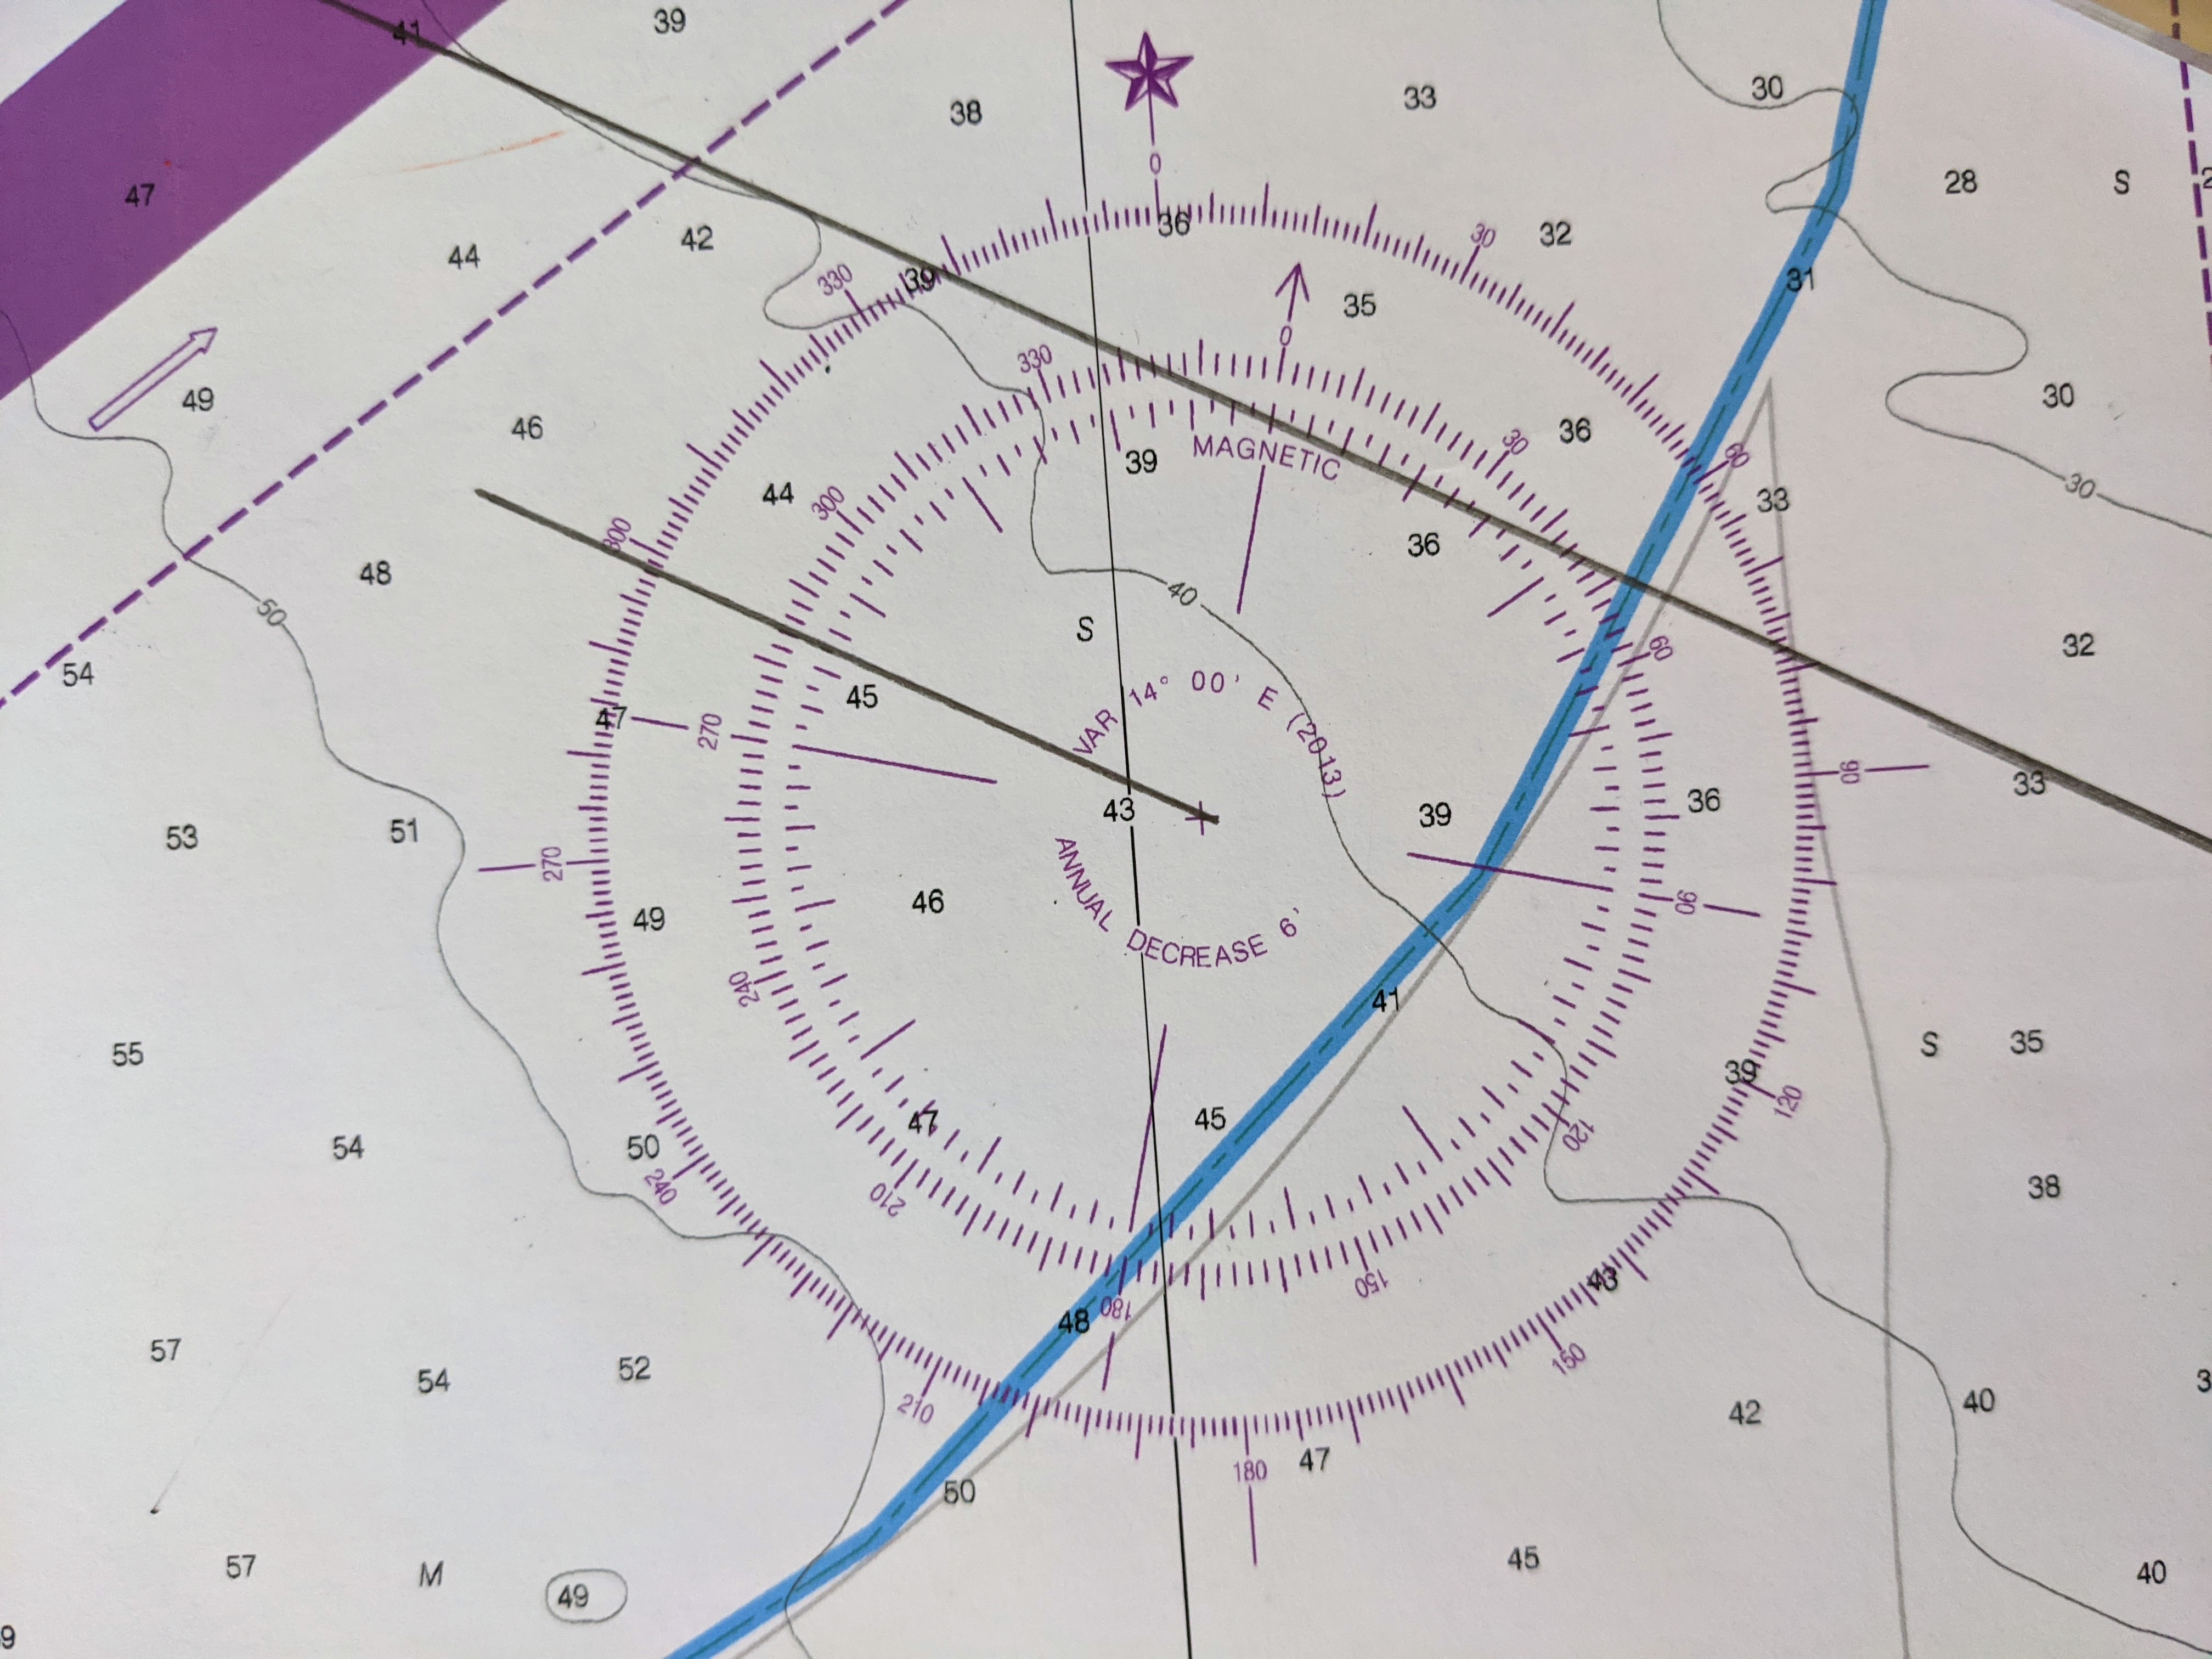
Step one: Using a convenient size of paper (in this case, 8.5 x 11), draw a horizontal line and a vertical line at approximately the center of the page. Label the horizontal line with the desired latitude and the vertical line with the desired longitude. In the example, Latitude 39N and Longitude 122 W were selected.
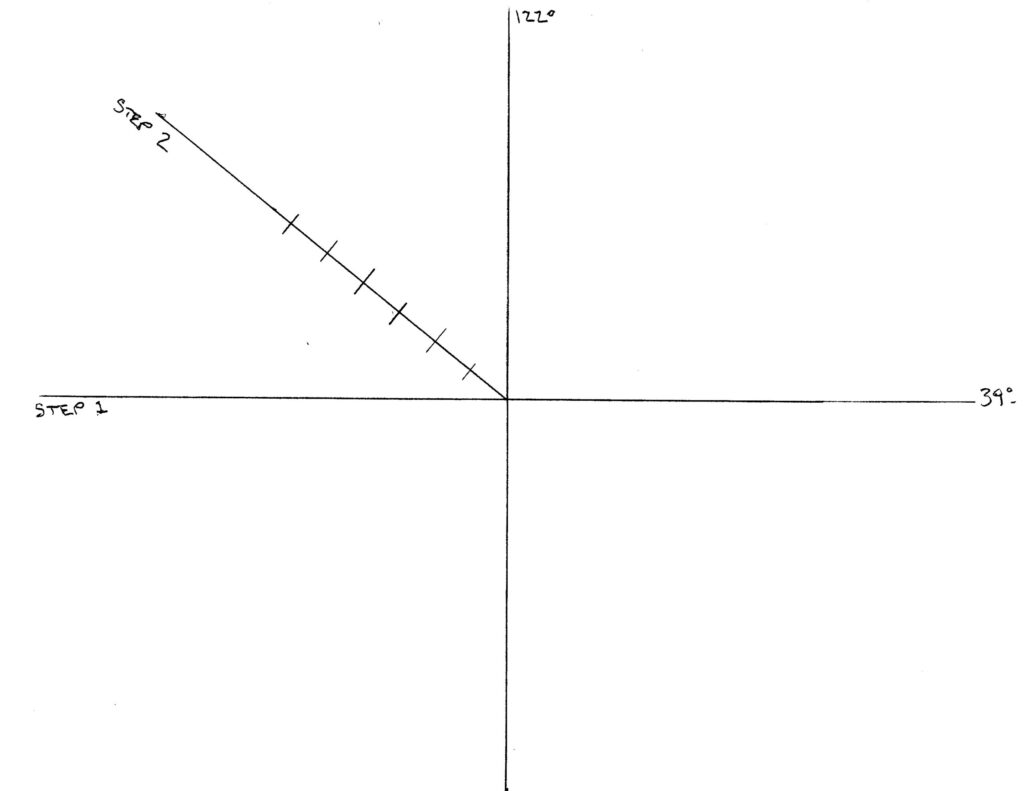
Draw an Angle Representing Your Latitude
Step two: Draw an oblique (diagonal) line representing the angle equal to the center longitude line. Here, the line is drawn at a 39 degree angle from the horizontal line.
Mark the oblique line in increments equal to the scale you have decided to use. I chose to use a scale of 1/2 inch for every 10 miles. Six equally spaced divisions every 1/2 inch is equal to 60 miles, or 1 degree of Latitude.
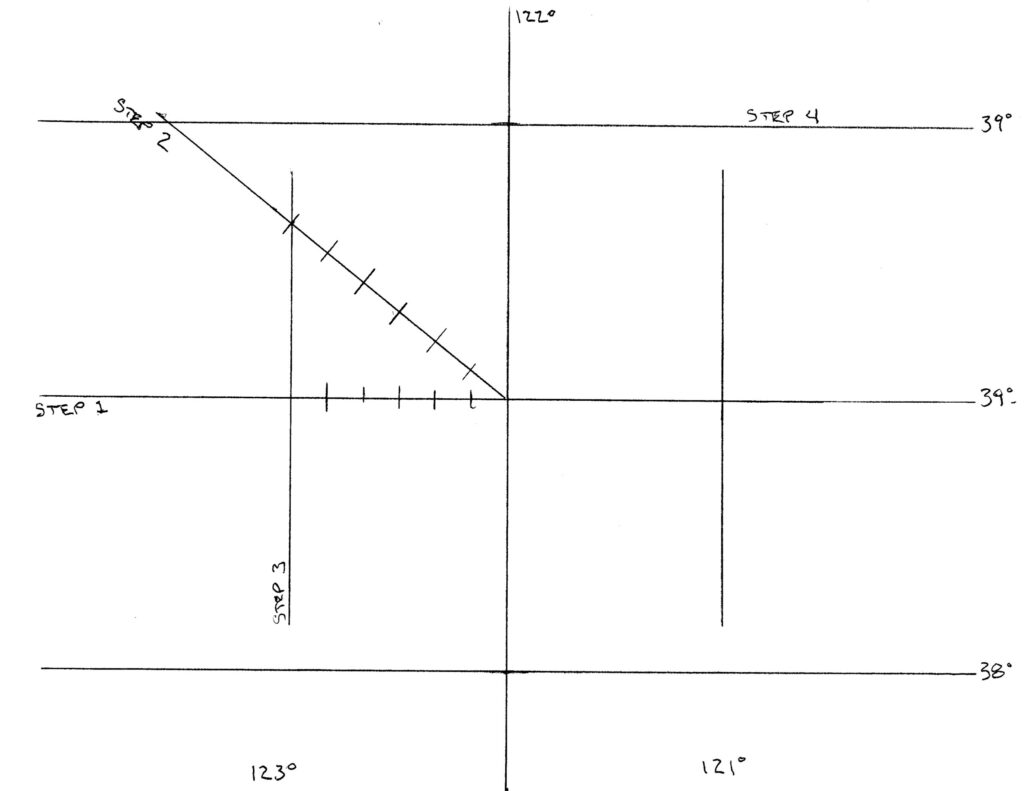
Find Your Longitude Lines and Minute Gradations
Step three: Drop a vertical line from the sixth diagonal division mark to the center latitude line. This line marks the location of the next degree of longitude. Draw another vertical line an equal distance away from the center longitude line on the opposite side. Your universal plotting sheet now includes 2 degrees of longitude. A final part of this step is to drop a mark straight down from each diagonal division down to the center latitude line. Each mark on the latitude line is equal to 10 minutes of longitude and each mark on the oblique line is equal to 10 minutes (miles) of latitude.
Find The Latitude Lines Above and Below the Primary Latitude Line
Step Four: Using dividers, measure the length of the oblique line from the center to its intersection with the longitude line. Swinging the dividers so it scribes an arc across the longitude line above and below the center latitude line provides the limits of one degree of latitude above and below the primary latitude line.
Set Up The “Minute” Marks
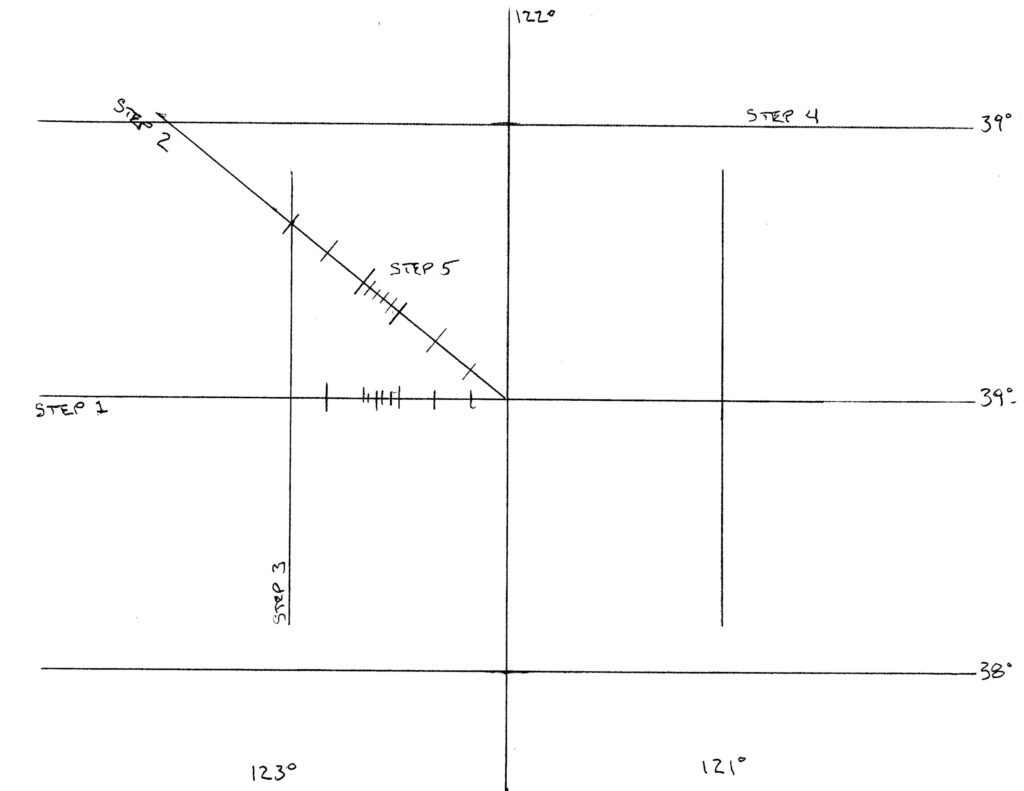
Step five: Finally, graduate the oblique line into convenient units. In the example, each marking is 2 minutes (miles). And, graduate a section of the latitude line into similar units.
Your Universal Plotting Sheet Is Ready To Use
Good news! You are ready to go. As drawn your plotting sheet covers an area of about 180 mile (E/W) by 130 miles (N/S).
A small amount of practice is all you need to get proficient.
A Final Note
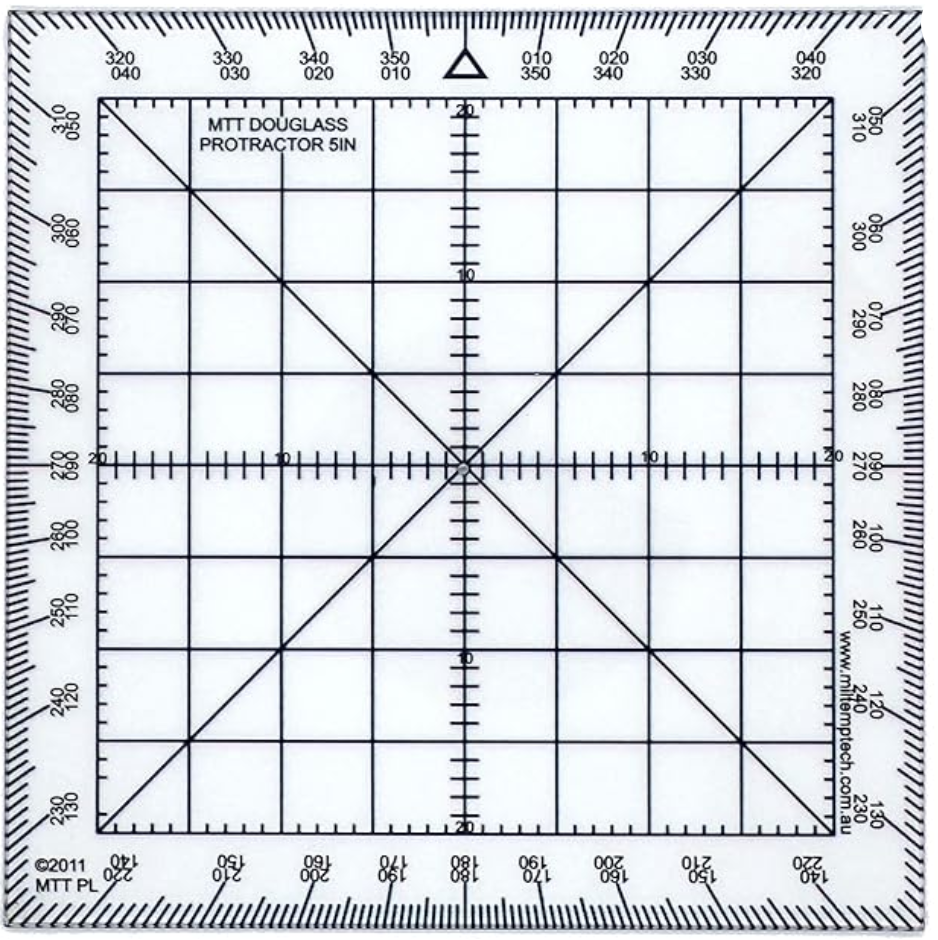
When using a universal plotting sheet, “standard” plotting tools may be a bit unwieldy. My personal preference is to use a 5 inch Douglass Protractor. It seems to be the perfect size to use with an 8.5 x 11 sheet of paper, and is conveniently marked off in 1/2 inch increments. As a bonus, each 1/2 inch is further broken down into 5 divisions, which can be used to represent 2 miles on the latitude scale. With those divisions marked on the plotting sheet is is very easy to interpolate into smaller distances.
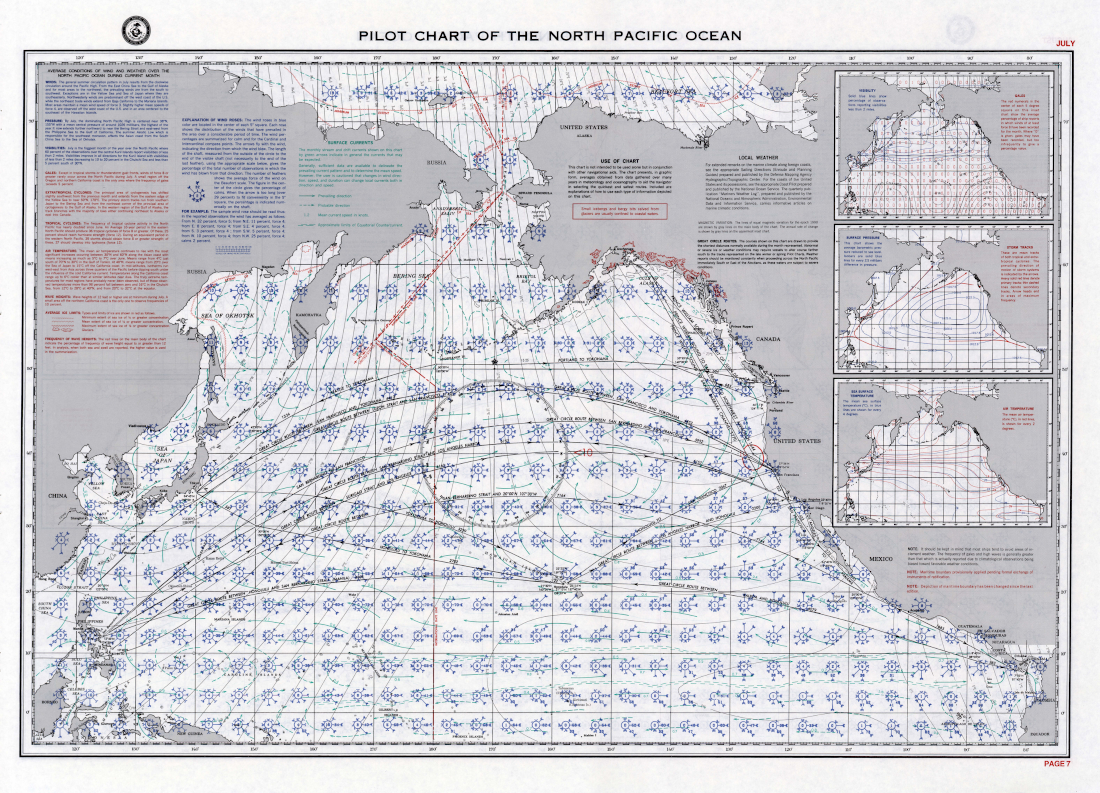
Pilot Charts provide the navigator with averages. Averages concerning prevailing winds and currents, air and sea temperatures, wave heights, ice, visibility, barometric pressure, and weather conditions.
There are five volumes of Pilot Charts, each being its own publication, and each covering a specific geographic region. Each publication is actually a compilation of twelve individual pilot charts, one for each month of the year.
Pilot charts are intended to aid the navigator in selecting the fastest and safest routes with regards to the expected weather and ocean conditions. Pilot Charts are not intended to be used for navigation, however, they are invaluable in planning stages of a voyage.
Pilot Charts may be downloaded from the Maritime Safety Information Publications website.
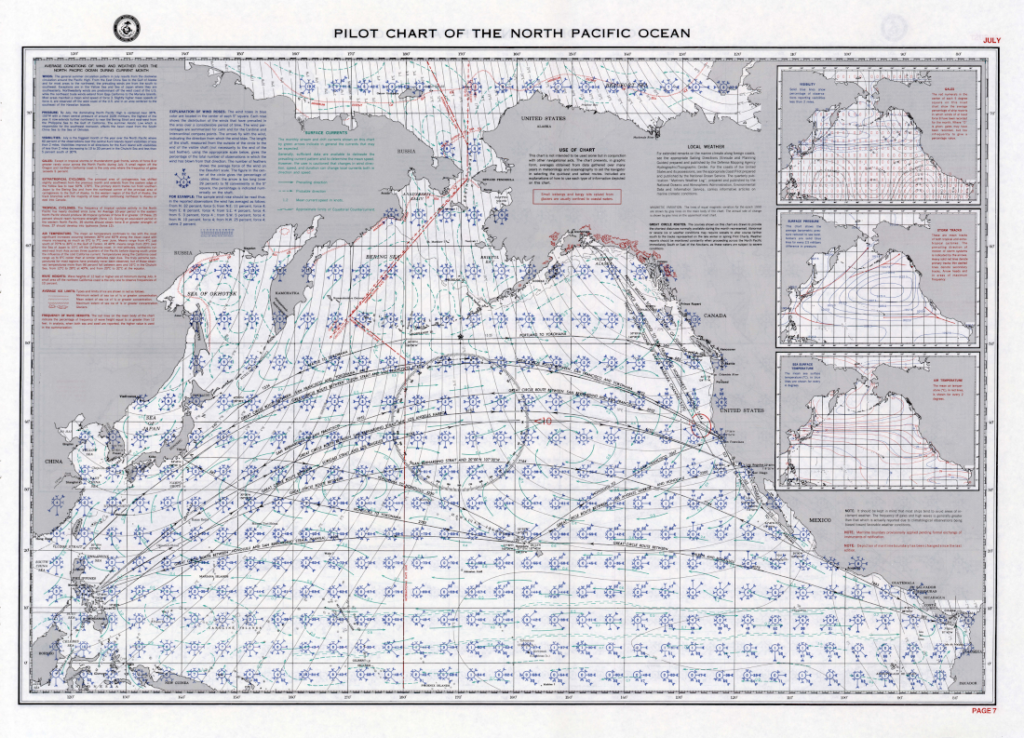
As can be seen in the image below, there is a great deal of information contained in a pilot chart. Most of this information will be explored and interpreted as we move through this post. In this case, we will be looking at average conditions in the North Pacific Ocean in the month of July. One very nice feature of a Pilot Chart is that it not only contains the data, but also instructions on how to use and interpret the data. Pilot Charts are very much self contained.
July Pilot Chart of the North Pacific Ocean (108jul)
The Main Body of the Chart
Wind Roses
As a sailor who primarily is interested in wind driven vessels, my primary concern when it comes to sailing is the wind. Will there be enough? Too much? What direction will it be coming from.
Fortunately, typical wind conditions is one of the primary pieces of information found on a pilot chart. Every 5 degrees (300 miles), east and west as well as north and south is a wind rose. Understanding the wind rose is critical to proper use of a pilot chart.
Wind Arrows
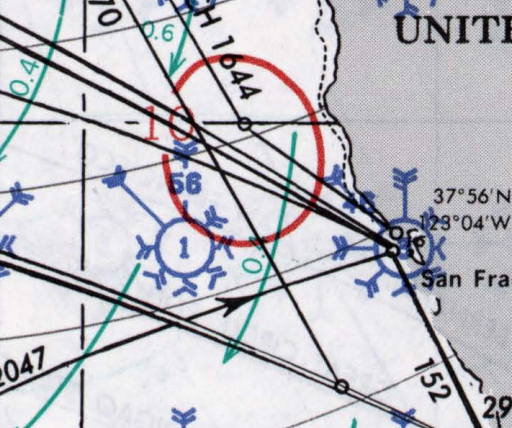
There is a wind rose sitting just offshore from San Francisco. Because of the land mass and printed information on the chart, it can be a challenge to read this rose, but let’s give it a try. We will start by looking at the wind arrows. There are eight of them, marking the cardinal (N,S,E,W) and intercardinal (NW, SW, SE, NE) compass points. The length of the arrow shaft tells you the percentage chance of wind from that direction (more on measuring it in a minute).
Wind Rose and Wave Height – Pub 108/Jul
In this case, the arrow coming from the NW has the number 45 printed on it. Any time a wind arrow is “too long”, it is shortened to a set maximum length and the percent chance of wind from that direction is printed.
Also included as part of the wind arrow are “feathers” arranged on each side of the shaft. There are four arrows, two on each side. The arrows indicated the Beaufort force of the wind coming from the indicated direction. That one arrow now tells us there is a 45% chance of force 4 winds (11-16 knots) coming from the northwest.
The length of the arrows not labeled with percentages can be measured and compared with a scale found on the chart. A quick measurement with dividers provided an 18% change of wind from the north at force 5 (17 to 21 knots).
Calm Days
The final item relating to the wind rose is the number within the circle at the center. In this case, “8”. There is an 8% chance of a calm day (less than 1 knot of wind).
Wave Heights
Before we move to the next graphic, the is one more piece of information found in the graphic above. The red solid line indicates the percentage change of 12 foot or greater waves during the month. Directly off of San Francisco, it is statistically rare, but it may happen. However, a bit to the north there is a 10% chance of 12′ or greater waves.
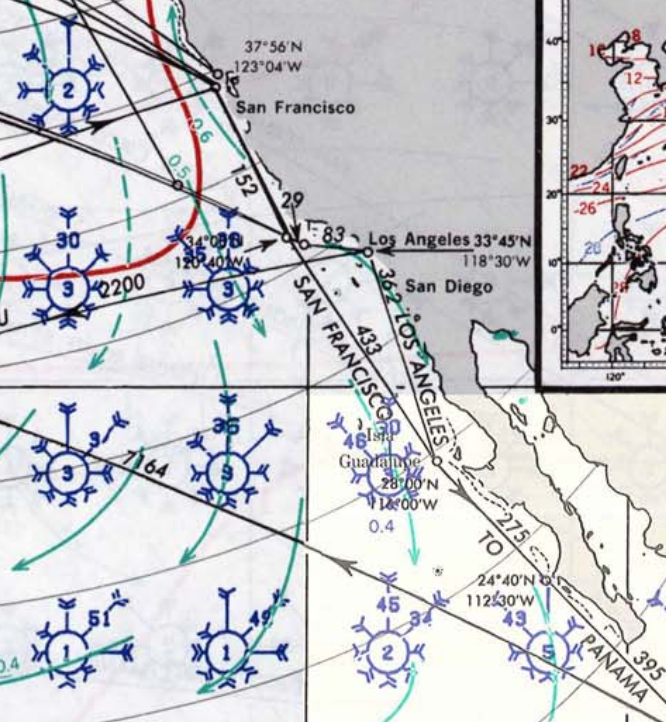
San Francisco to Cabo San Lucas in November
Why is November the most popular time to go from San Francisco to Cabo? Generally no hurricanes and some nice 15 knot winds from the North or North West.
Before we move on to the next topic, here is a quick planning exercise for an imaginary trip from San Francisco to Cabo in November.
Off of San Francisco, about 40% of the time the wind will be out of the N or NW at force 4, with calm days expected only 2% of the time. Waves of 12 feet or greater are expected 10% of the time.
Near Los Angeles, the wind will be out of the N or NW at force 4 about 76% of the time.
Nearing Cabo, the prevailing winds are still out of the N or NW over 70% of the time, however, the intensity has dropped to force 1 (1 to 3 knots)
Surface Currents
A new piece of information contained on the chart also presents itself in this exercise. The green arrows represent the expected current in the area. Mostly going down the coast on this trip, currents of .4 to .5 knots will help you on your way. However, if you look close, near shore north and south of San Francisco is a counter current heading north at .6 knots. Staying close to shore could add an extra 4 hours to your trip during the first 200 or so miles.
Two additional topics covered in the main body of the Pilot Chart that may not be of general interest to most sailors are the limits of ice during the month, and a plot of great circle routes (including distance) between a number of major ports. It is nice to know where they are, and the distance from place to place. San Francisco to Yokohama is 4452 and is composed of an arc starting at the 38th parallel, then traveling as high as the 48th parallel before dropping back down to latitude 35.
Average Weather Conditions
In the upper left of the chart is a general text description of the average conditions of wind and weather. Topics covered include:
Winds
Pressures
Visibilities
Gales
Extratropical Cyclones
Tropical Cyclones
Air Temperature
Wave Heights
Average Ice Limits
Frequency of Wave Heights
Sub Charts
In Addition, graphics of the topics shown above are included.
Sub chart showing percentage of reduced visibility and gale force winds.
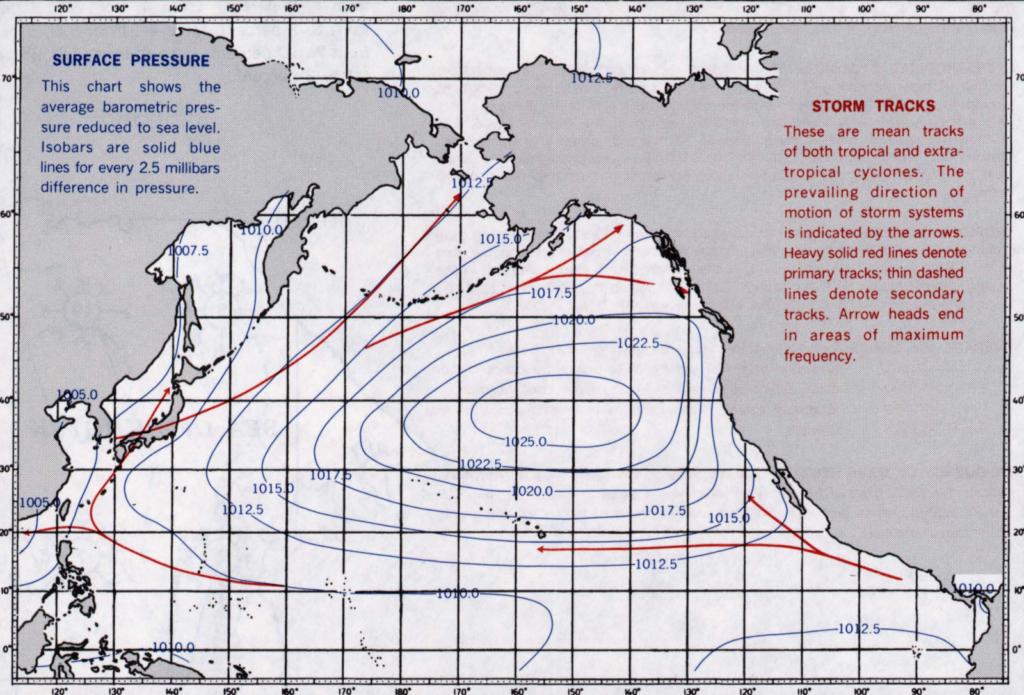
Sub chart showing storm tracks and location of pressure systems. In this case, the North Pacific High.
Air and Sea Temperature
A sub chart is included (not shown) indicating average air and sea temperatures in the area for the depicted month.
Reading almost any book on coastal navigation leaves most people with the impression that the running fix is not used much. This can not be further than the truth.
Important to Coastal Navigation
I find that while navigating along a coastline, the opportunity to complete a running fix presents itself more often than being able to obtain a two or three bearing fix. Once taken, a bearing to an object is later be “advanced” in time and compared with a new bearing of the same or a different object providing a fix. This new bearing can then be advanced to compare with another object coming into view later.
Over time, if only one object at a time is in view, you are still able to fix your location.
Essential to Celestial Navigation
On top of this, when you move on to celestial navigation techniques, you are going to find that the foundation is the running fix. You may be able to get a celestial fix using three celestial objects (e.g. sun, moon, and a star), however, more often than not you will get an LOP from a morning sun sight, followed by LOPs derived from noon and afternoon sun sights. “Advancing” the earlier sights to the time of the most recent one is what gives you your location.
How Does it Work
While on your course, take a bearing of an object
Plot the bearing on your chart
Continue on course for a period of time (let’s say 30 min)
Take a second bearing of an object (could even be the same object)
Calculate the distance traveled between bearing 1 and bearing 2 (at 5 knots for 30 mins, distance equals 2.5 miles)
Advance the first bearing line 2.5 miles along your course line (yes, this is where it seems to get hard. Don’t worry.)
Plot the second bearing.
The location where the advanced bearing and the second bearing cross is your fix location
Let’s See It
If you are anything like me, that list doesn’t quite explain everything. So, we will set it up visually.
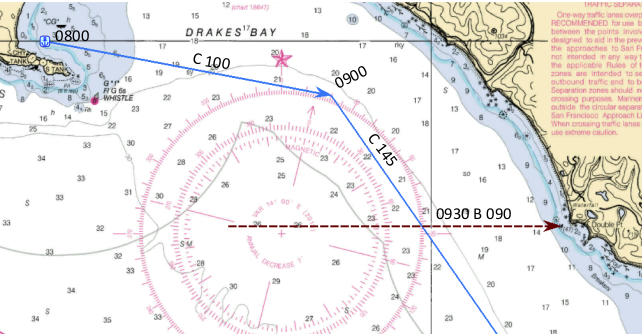
It is 0800 and you are leaving your anchorage at Drakes Bay in the fog.
To stay well clear of the Point Reyes shoreline, you plan a course of 100T, which you intend to follow for 5 miles. Traveling at an estimated 5 knots, your follow the 100T course for 1 hour then turn to 145T keeping an appropriate DR plot.
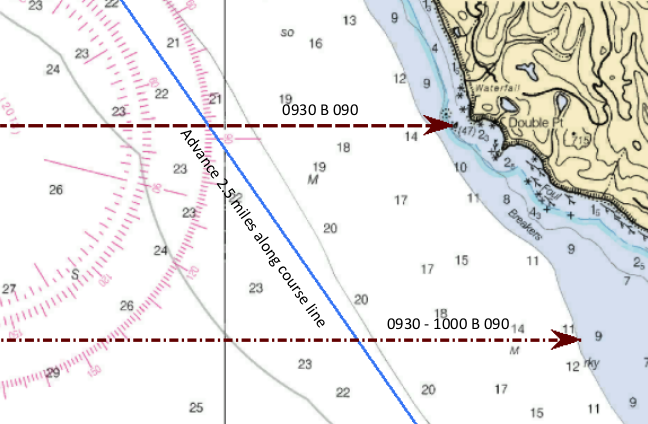
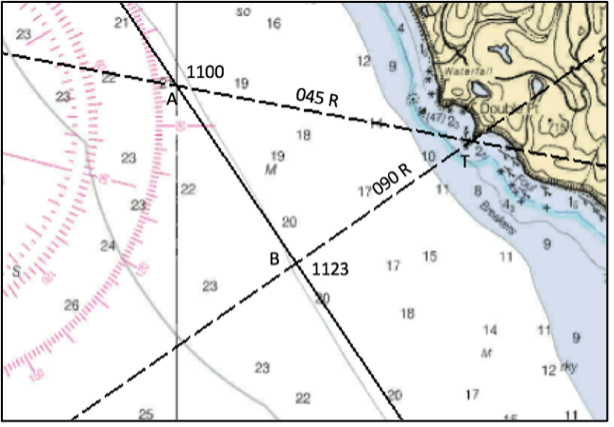
At 0930, while on a course of 145T, the fog lifts and Stormy Stack becomes visible. A bearing of 090T is obtained and plotted on the chart. See the brown dashed line.
Continue on your course
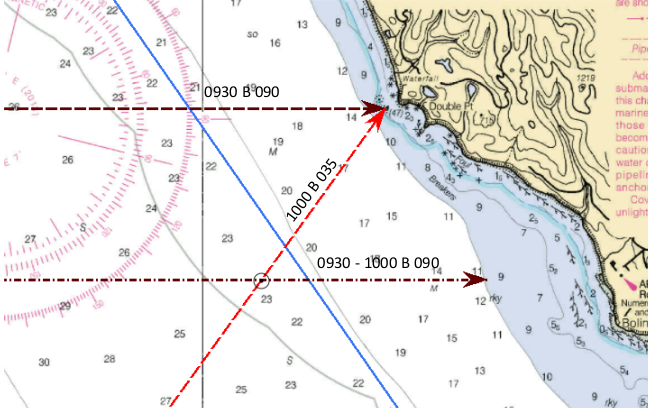
At 1000, 30 minutes later, take a new bearing of Stormy Stack. In this case, 035T, but don’t do anything with it yet.
Advance the First Bearing
This is the part that seems tricky, but really isn’t. Estimate how far you have travelled between the 0930 and 1000 bearings. In this case, at 5 knots for 30 minutes, approximately 2.5 miles.
Measure along the course line 2.5 miles from where the 0930 bearing crosses. Plot a line parallel to the 0930 bearing line, making it pass through the spot you just located 2.5 miles along the course line. See the brown dot/dash line
Almost There!
Plot the new 1000 (035T) bearing to Stormy Stack. Shown here as a red dashed line.
Your fix location is at the intersection of the new bearing line (labeled 1000 B 035) and the advanced bearing line (labeled 0930-1000 B 090).
An Important Note
You may notice the only part of the DR plot used is the course line! Do not confuse yourself with trying to make your DR times and DR positions a part of the running fix. They are not needed, and only make things more difficult.
Step 1 & 2 – Take a bearing of an object and plot on chartSteps 3 though 6 – Continue on course and advance the bearing.Steps 7 & 8 – Plot the new bearing
Along the Way
While this running fix was taking place, a couple of other important navigation tasks could have been performed.
When the first bearing was taken at 0930, an Estimated Position could have been figured.
At the 1000 Running Fix, it would be logical to calculate Set and Drift.
A More Complex Example
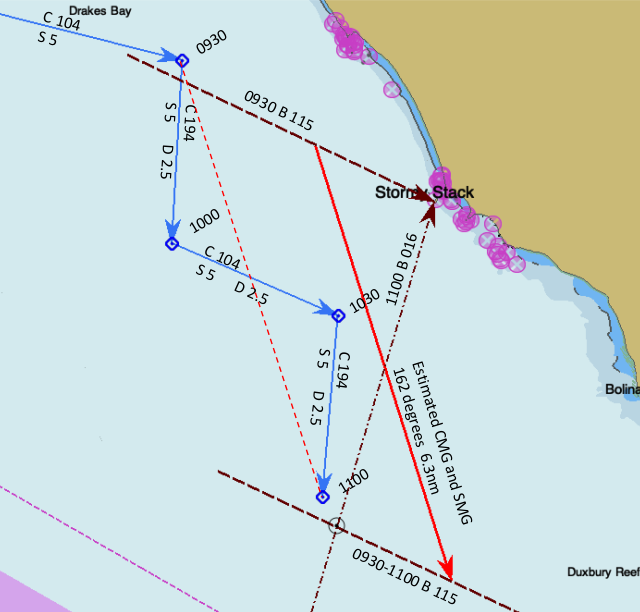
Example of running fix with multiple course changes.
You don’t always have the luxury of sailing in a straight line long enough to complete a running fix. Fortunately, the process works even with changes in course and speed.
In this example, a bearing to an object was taken at 0930, simultaneously with a change in course. A DR position was plotted at the time, as well as the bearing LOP (brown dashed line). Other course changes were made at 1000 and 1030. In each case, a DR was plotted.
At 1100 a second bearing of the same object was made and plotted (brown dot-dash line).
To advance the 0930 bearing, measure the course and distance from the 0930 DR to the 1100 DR (dashed red line) to come up with course made good (CMG) and speed made good (SMG). In this case 162T and 6.3nm.
Starting from any point on the original 0930 LOP, plot a line 6.3nm long at 162 degrees (solid red line). Advance the 0930 LOP forward to the end of this line. You now have your running fix.
To improve the accuracy of this fix, an estimated position could have been determined at 0930 and at 1100. The CMG and SMG would then be determined based on the estimated positions.
One Last Thought
Over or under estimation of boat speed results in inaccuracies in the running fix. Fortunately, while a running fix is subject to error the error is not large. It is considered a good position fix.
Remember to “reset” your DR plot once the fix is established.
The idea of a “Danger Bearing” is a simple one. Unfortunately, as navigators we often try to make is more difficult than it really is. Here we explore what danger bearings are and how to use them as a prudent mariner.
A danger bearing does not take into consideration your vessel’s course, heading, or destination. It simply tells you which side of a line you are on, the “safe” side, or the “dangerous” side.
It is Like an LOP
A danger bearing is similar to a line of position. It is a bearing to an object. However, the bearing line is drawn from known safe water so that it passes to the side of a navigation danger like a submerged reef, a wreck, a breakwater, etc.
Two Examples
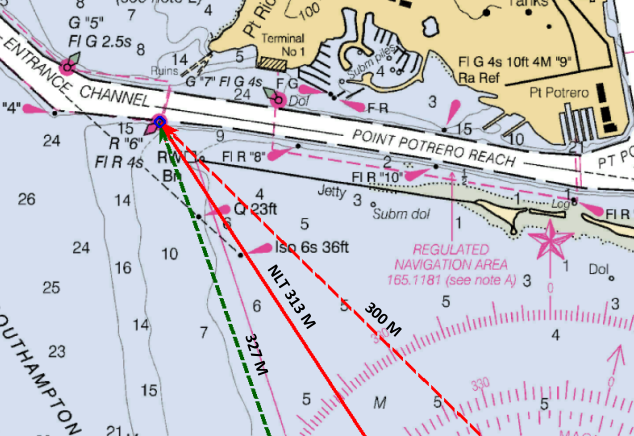
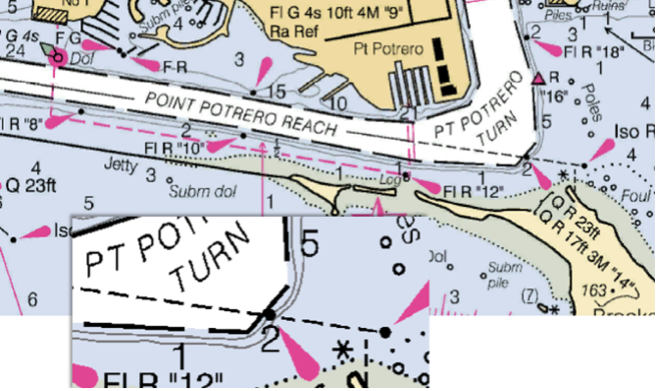
The first example shows the entrance to Point Potrero Reach in San Francisco Bay. The reach is guarded by a rock breakwater to the south. Obviously, the only safe way to get into the reach is by going around the breakwater. Simple during the daytime. Not so easy at night.
However, at night buoy R”6″, which sits off the end of the breakwater, flashes red every 4 seconds and makes a perfect guide into the channel.
Setting up the Danger Bearing
Use a chart to layoff a bearing to R”6″ which passes safely off the end of the breakwater.
Indicated in the graphic with a solid red line, the bearing is labeled with the magnetic bearing of 313 M. The label also includes the letters NLT. More on that later. This is the “Danger Bearing”
Hopefully, it will be obvious that if you are heading toward the buoy, being on one side of the line your vessel is in safe water. The on other side of the line your vessel is heading toward the breakwater and danger.
No More Than/No Less Than
Let’s say you are on a vessel and take a bearing of R”6″. If the bearing is 300M your vessel would be on the red dashed line. If it is 327M you are on the green dashed line. Which of these would indicate danger? In this case, 300M, which is less than the 313M, would indicate danger. Which leads to the conclusion that a bearing of the buoy should never read less than 313M. On the bearing line this is notated as NLT (no less than). If danger is found on the other side of the line, the notation would read NMT (no more than)
Danger to the North
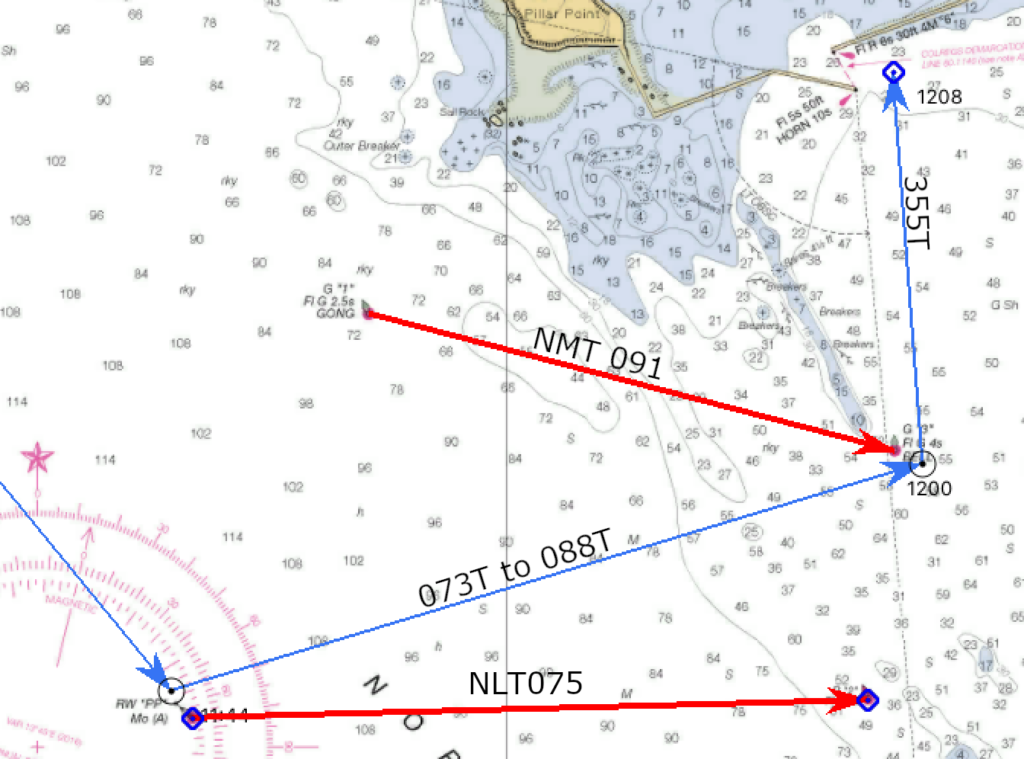
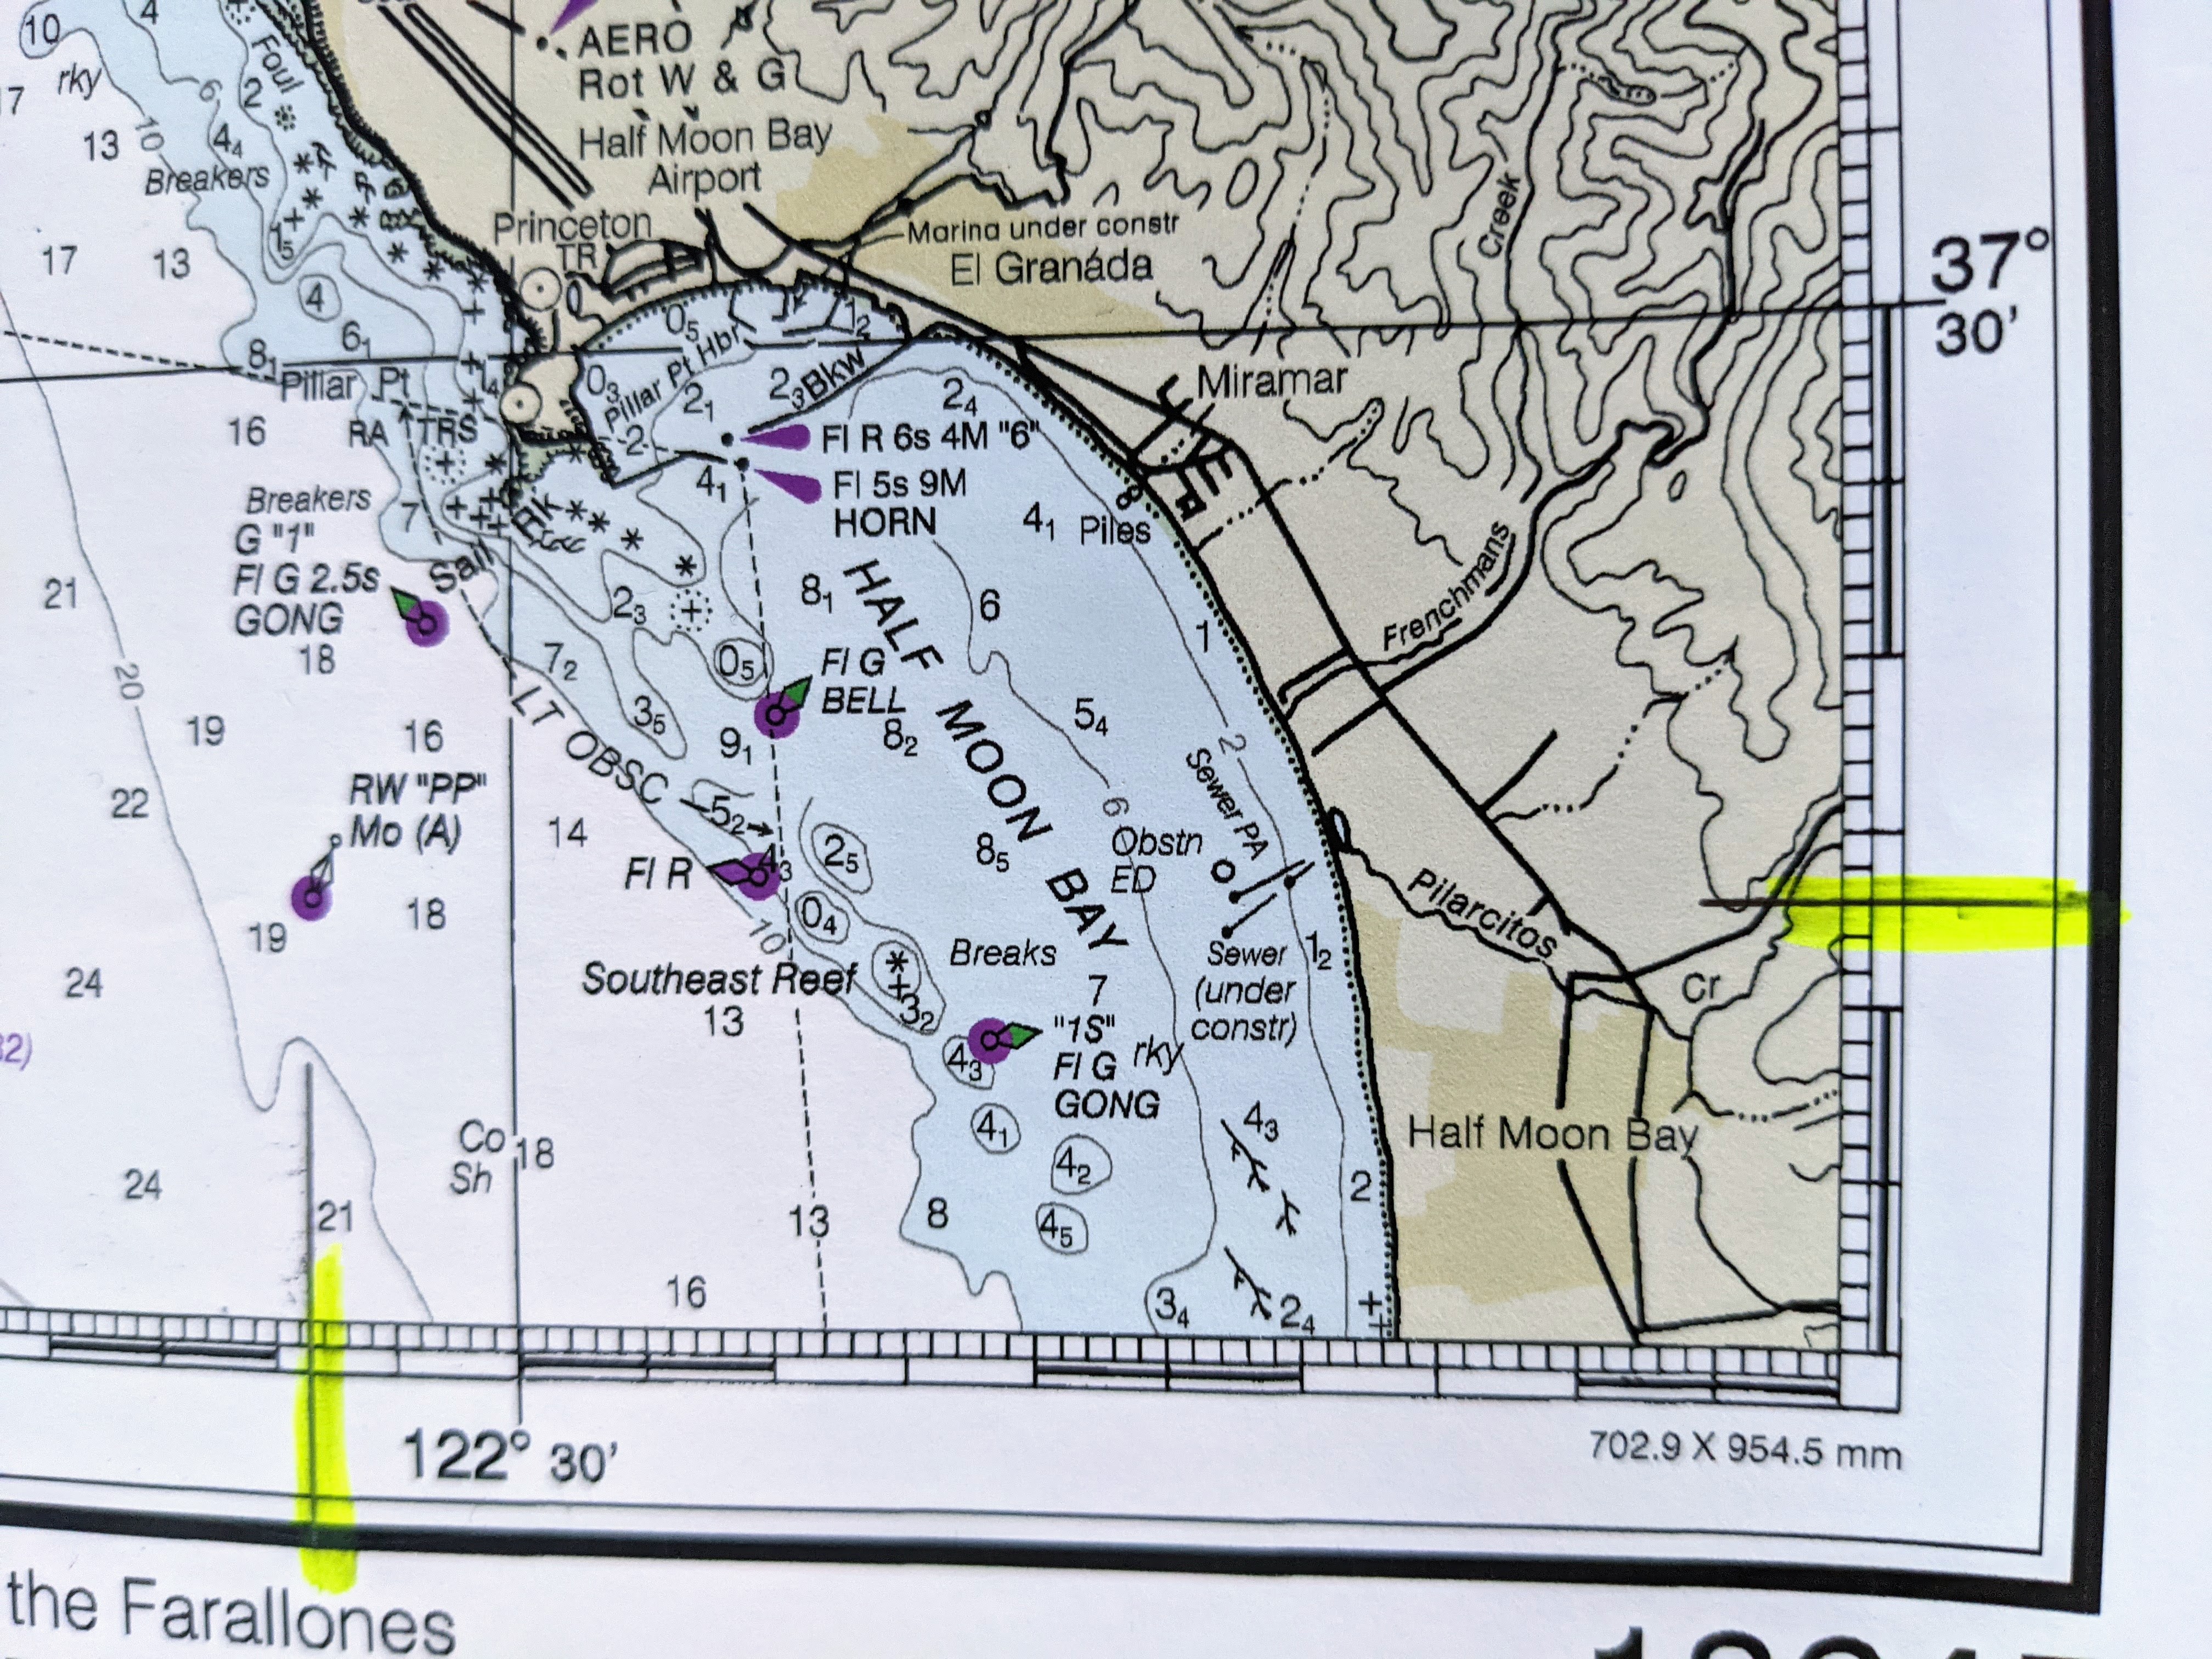
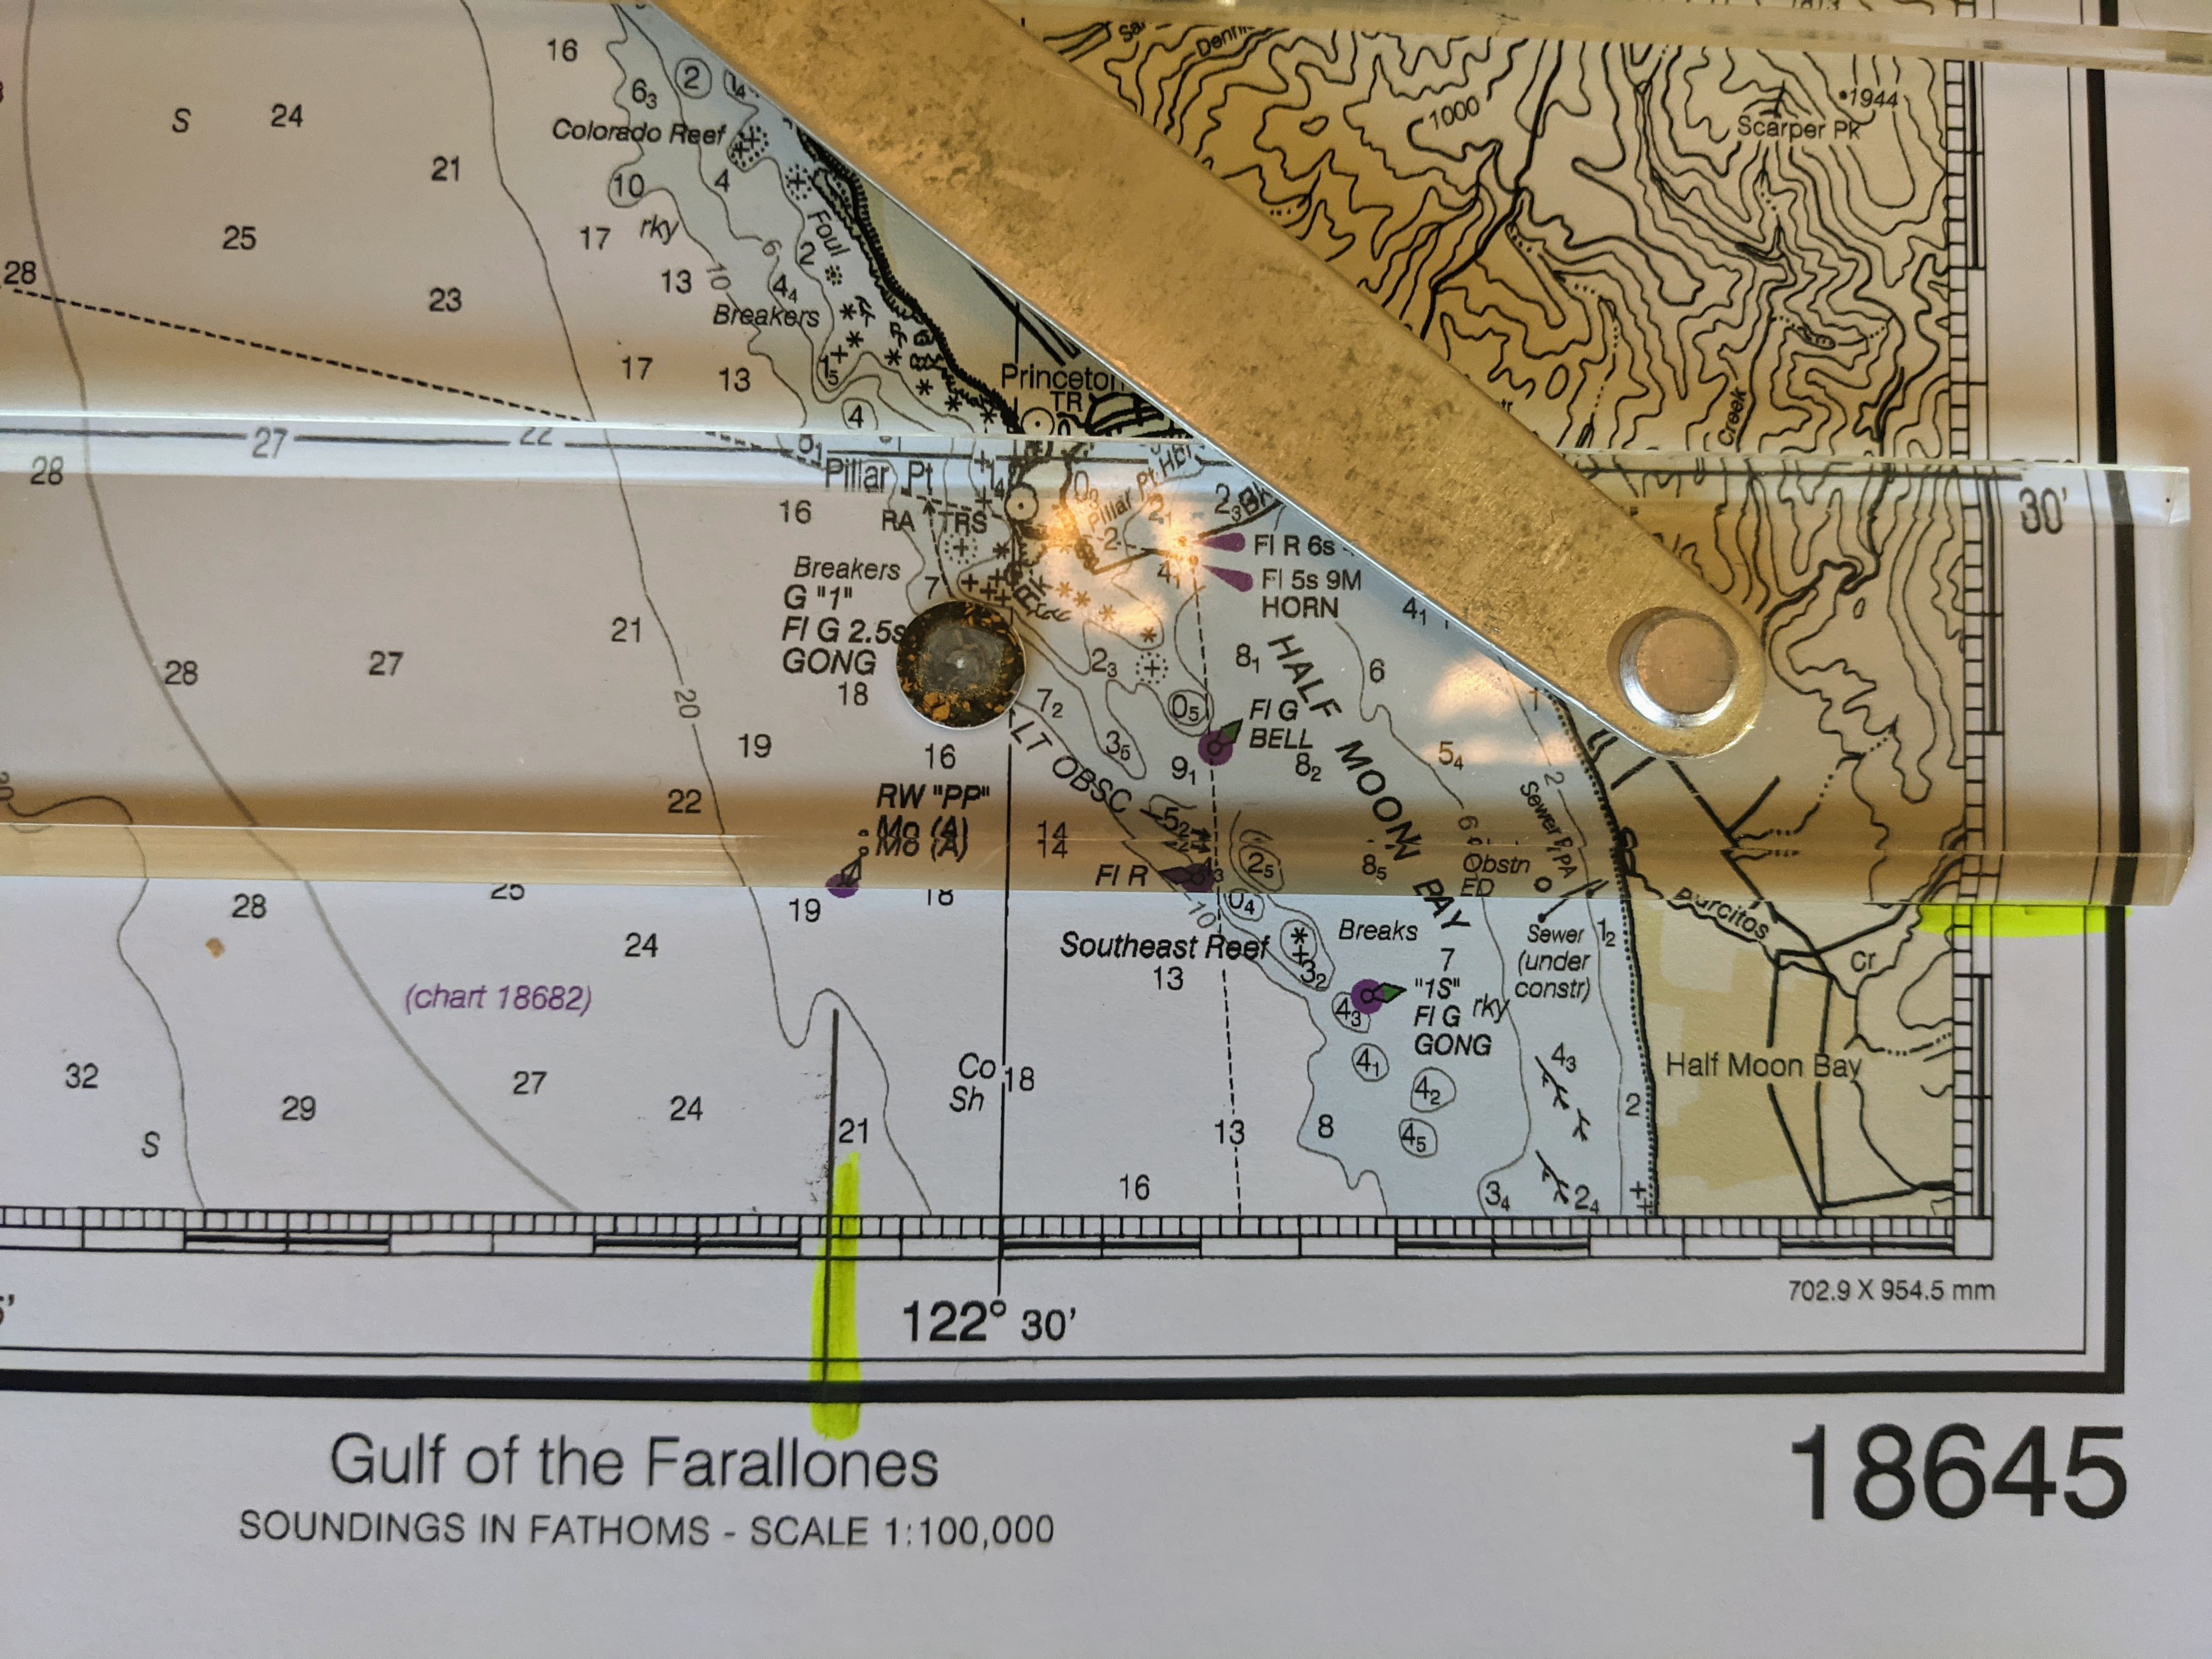
From the North or West, entering Pillar Point Harbor in Half Moon Bay requires you to travel between two submerged reefs. Day or night, use of a danger bearing assists you safely through the reefs and into the harbor.
In this case, two green buoys have been placed to mark the safe limits. A line from G”1″ to G”3″ gives a danger bearing to G”3″ of 091M. A vessel located north of that line is in danger, and would get a bearing greater than 091M. Therefore, the danger bearing into Pillar Point should be NMT 091M.
Danger to the South
Entering any strange harbor should always be done from a known point of safe water.
In the case of Pillar Point Harbor, a safe water mark (RW “PP”) has be placed about 1.5 miles west of the reefs. In the graphic above, a course was laid off from “PP” where turning or drifting to port heads through the reefs on the north side.
G”3″ is paired with R”2″.
A second bearing line from “PP” to R”2″ provides a southerly danger bearing of NLT 075M.
Why Magnetic
I am a firm believer that all bearings marked on a chart should be in degrees True. There are two exceptions:
Bearings relative to your vessel are always marked as relative (otherwise they would not be relative bearings.)
Danger bearings must be marked in magnetic. If you are in danger, you must know immediately. When checking your locations against a danger bearing, a hand held compass is used. The bearing that is read will be in magnetic. Converting to true takes valuable time better spent getting out of trouble. Mark your danger bearings in magnetic so that you recognize immediately that you are in danger.
There is a wide array of tool options to assist you in navigation plotting. All have pluses to recommend them as your “go to” tool. Unfortunately, all also have cons that make them less desirable or more challenging to use. This tip is specifically how to use navigation protractor triangles (just call them triangles). For a discussion of the plusses and minuses of the other options, check out the lesson on “Navigation Tools – Plotting Tools“
Using Navigation Triangles
Why Triangles (aka: What is a Protractor)
Before we talk about why I prefer using triangles over the other plotting tool options available to me, let’s talk about the down side.
Quite simply, there is a bit of a learning curve to use them well. However, most everyone that I know who has learned to use them asks why they thought it was hard. That’s it, the down side is a pretty short list.
The Up Side (why I prefer them)
They are less prone to slipping when you are using them. Think rolling boat in 6 foot seas. Less tool slippage is good!
They are more accurate. Using the compass rose to read directions at best you can see 1 degree of accuracy at best. Using a triangle actually allows you to estimate directions that fall between the 1 degree marks.
There is a built in “reciprocal” scale. One of the more common mistakes I see is marking the reciprocal of the course you want. For example, a course of 260 marked as 080. One time, in a class I was teaching, we were leaving Santa Cruz Harbor. The first course to get out was marked correctly. The second course was inverted to the reciprocal of the correct course. 180 degrees the wrong way. I noticed the error, but let it happen as a learning experience. The net result. When we made the turn to the new course we were pointed directly at some rocks. The class realized right away there was a problem, figured out what the problem was and fixed it. That was in clear weather. Would they have realized it in fog?
There is a built in scale of “Cardinal” and “Intercardinal” Points. Whoa … what is that? Cardinal Points are North, East, South, and West. Intercardinal Points are in between. For example, between North and East there are NNE, NE, and ENE.
There is a built in milage scale. If you are using a chart with a 1:80,000 scale (check the scale Martha’s Vineyard to Block Island Training Chart) you don’t have to mess with the latitude scale to find mileage. It is build in along the long edge of the triangle. 1:80,000 is a very common scale.
How to Use Navigation Triangles
Drawing a Course Line
To draw a course line from Point A to Point B, you pretty much need a straight edge long enough to stretch from one point to the next. A single triangle is about 10 inches long. Two of them laid long edge to long edge will easily stretch 18 inches. Drawing a line longer than that will require a separate straight edge, such as a ruler or that parallel rule sitting unused in your navigation tool drawer.
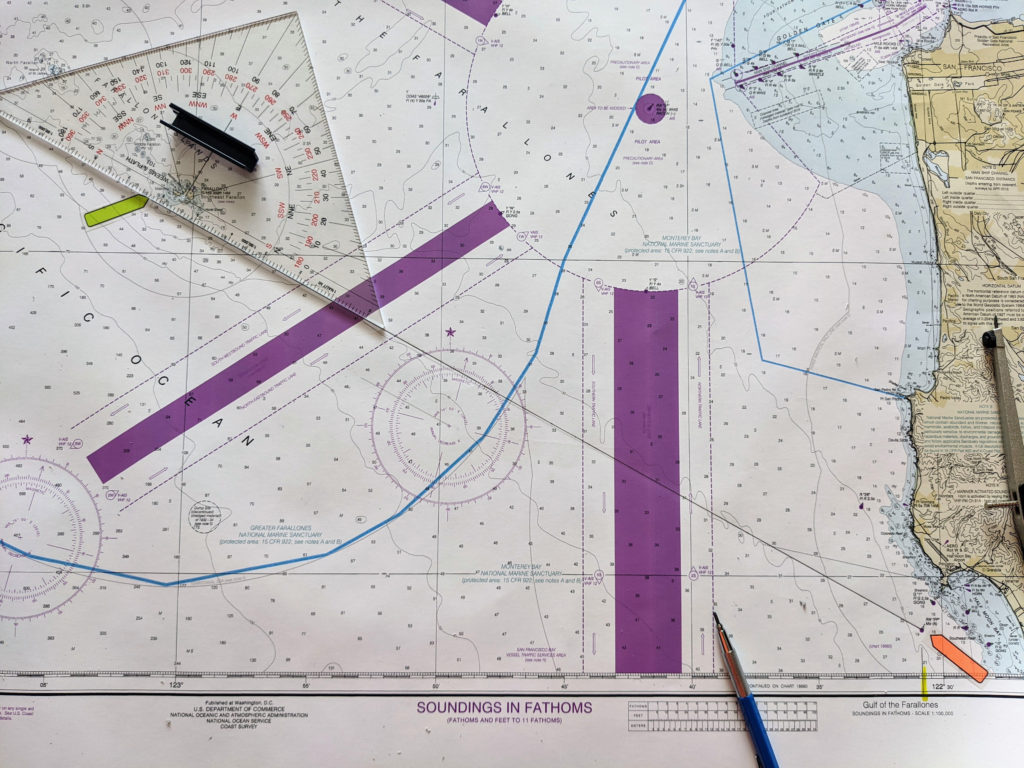
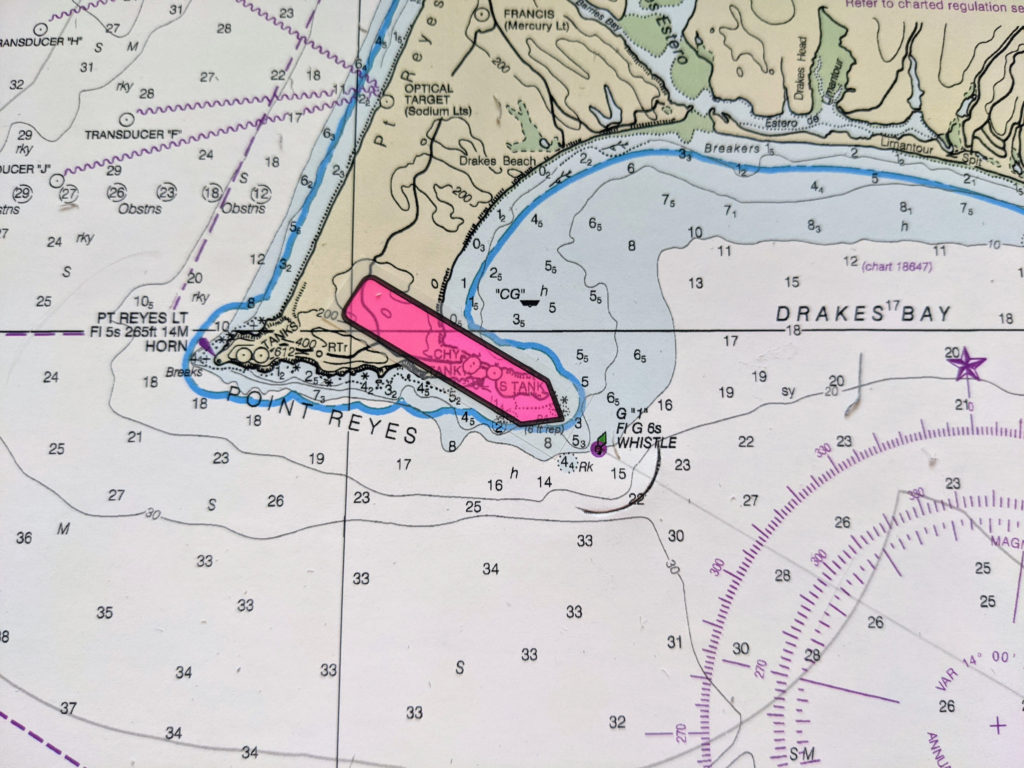
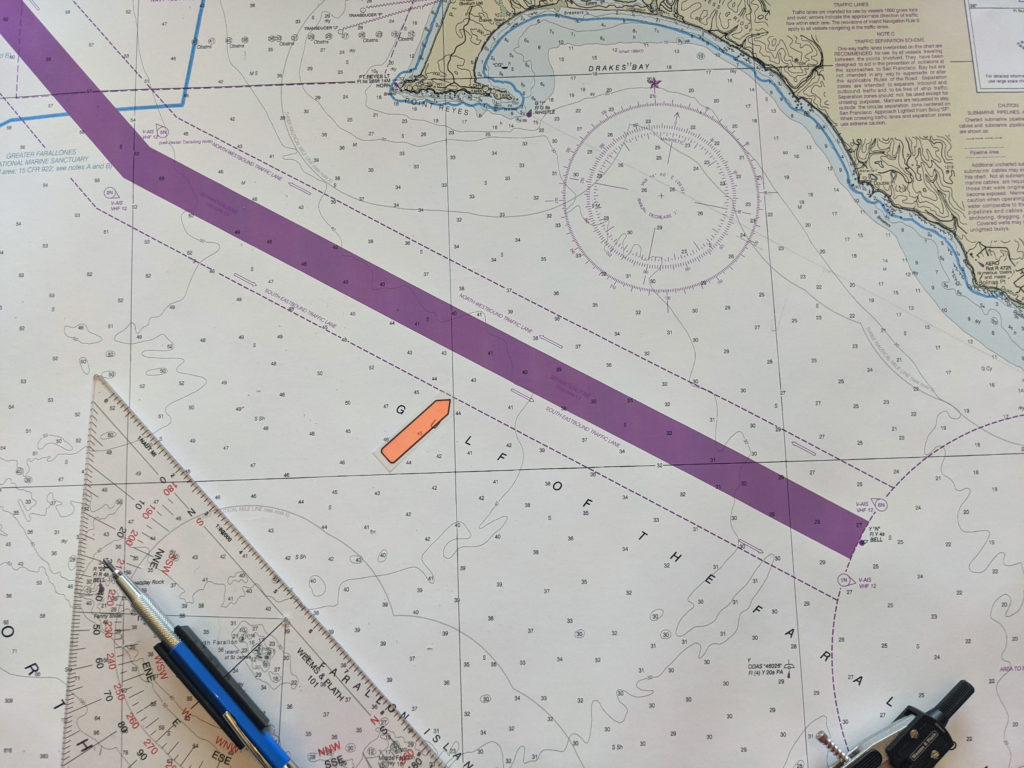
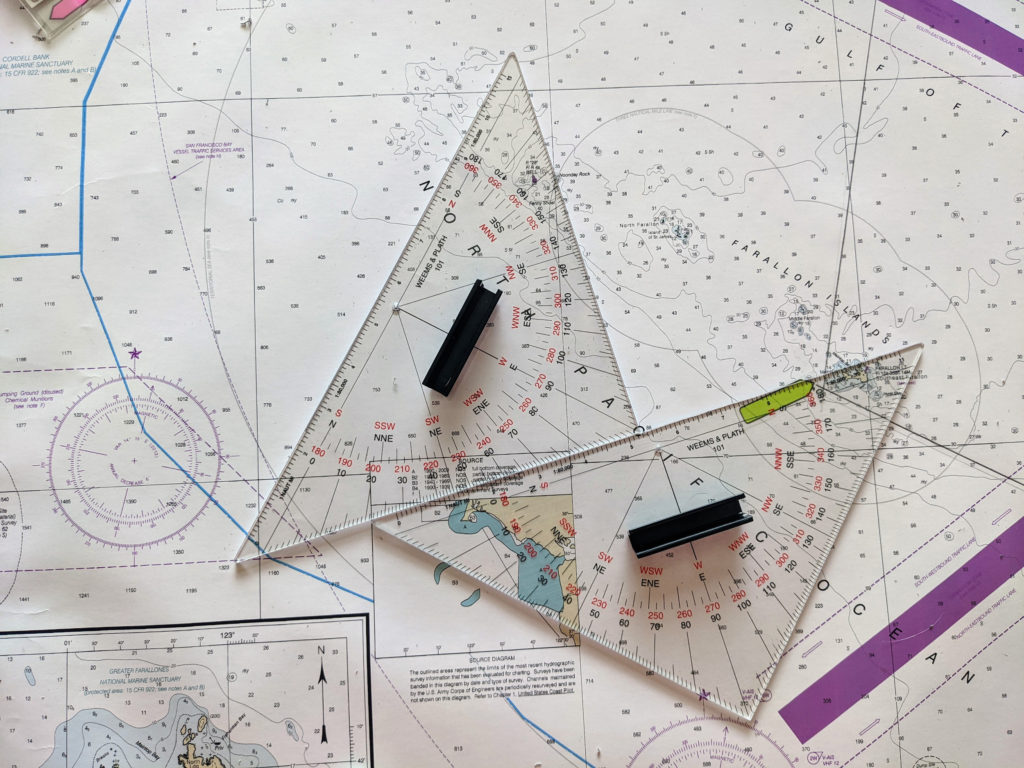
For example purposes, let plan a course from the Pillar Point safe water mark outside Half Moon Bay (orange arrow in images) to Drakes Bay, going around the west side of Southeast Farallon Island (green arrow in images).
Knowing that Southeast Farallon Island can be dangerous, we will plan to stay in water deeper than 60 feet (10 fathoms). We will also plan to stay .5nm away from the green buoy marking the reef at Drakes Bay (pink arrow in images).
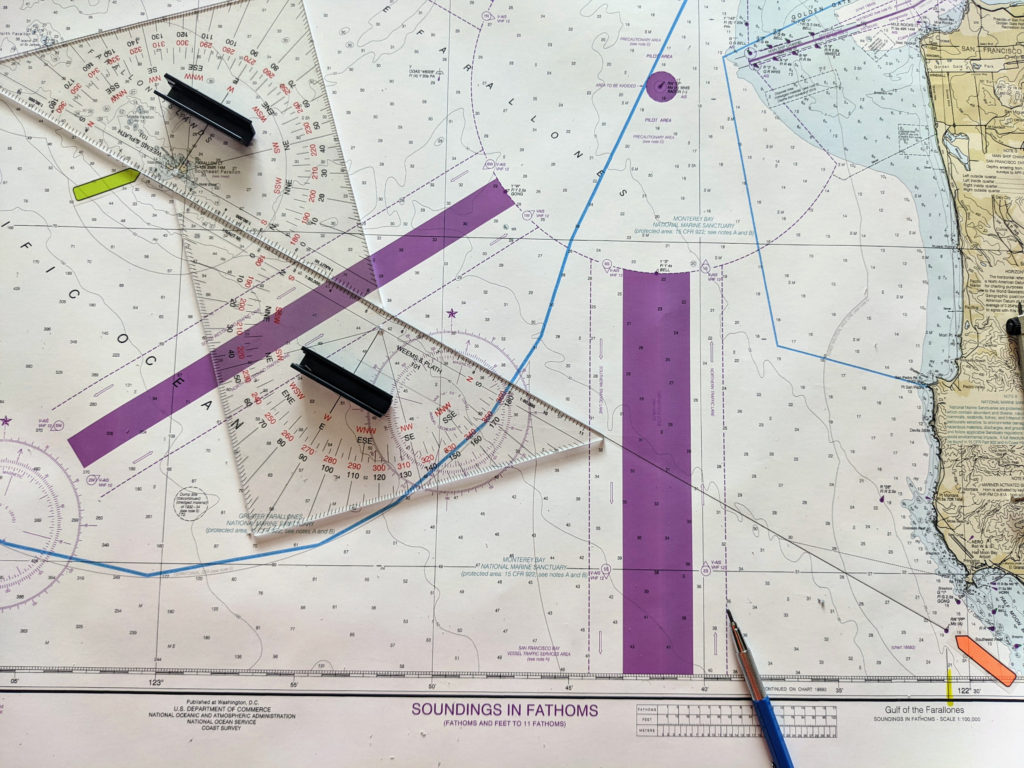
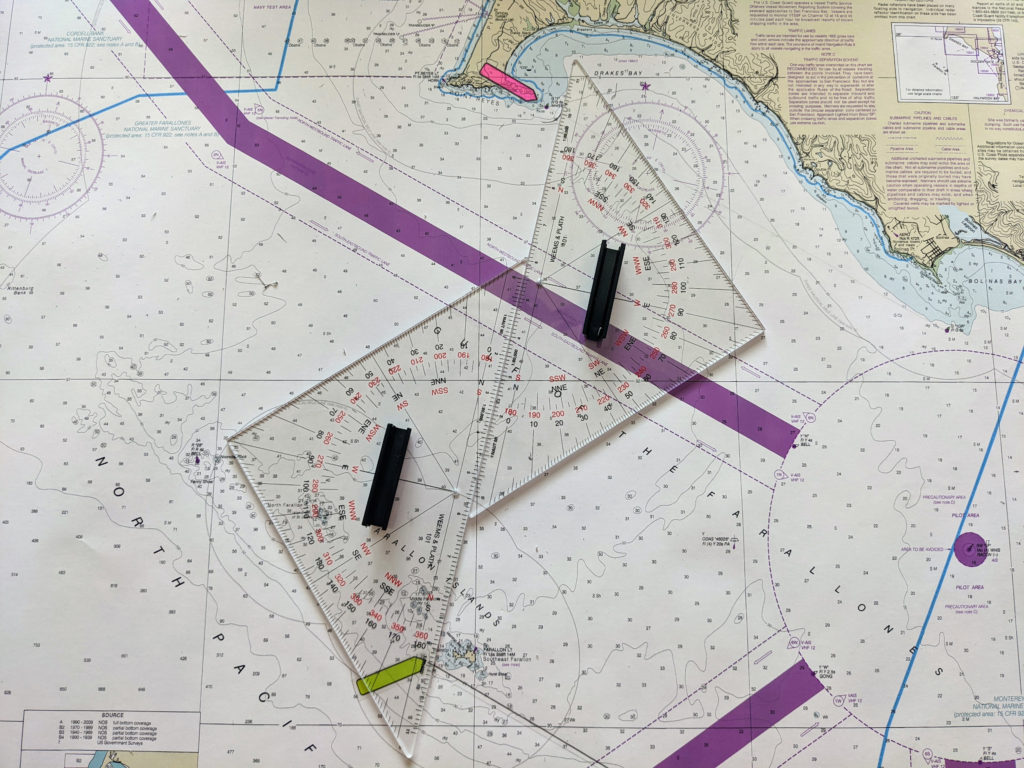
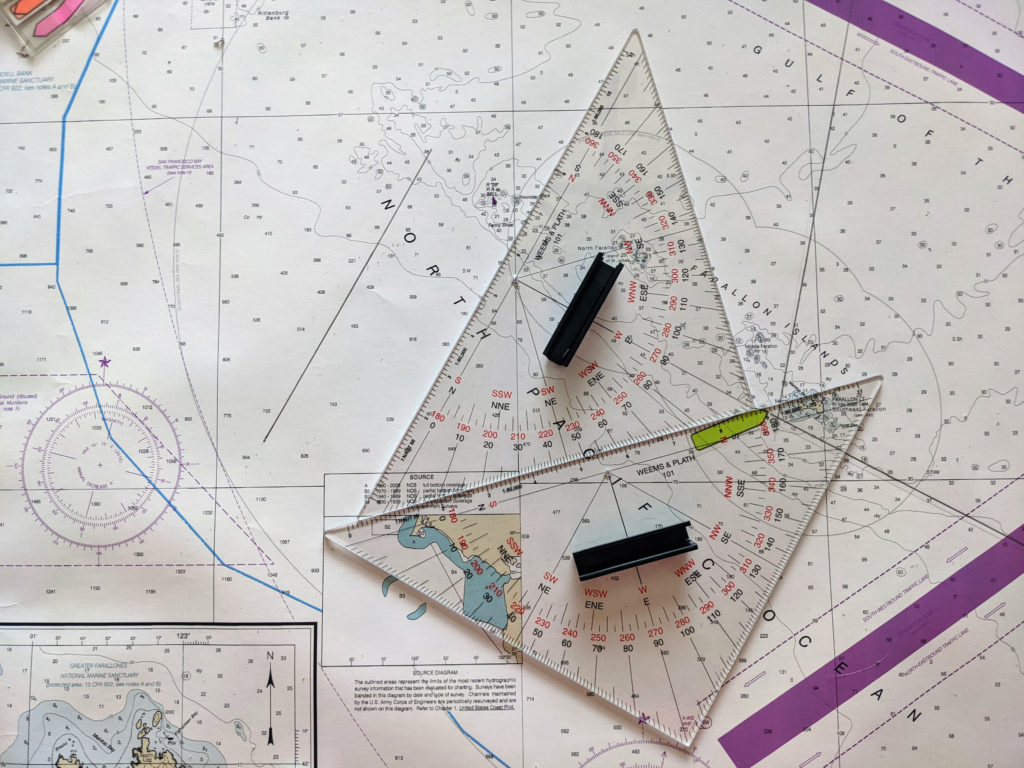
Two overlapping triangles just reach from Point A to Point B
First half of line is drawn. Do not draw the second half of line along edge of second triangle. Slide the first triangle up.
Draw the second half of the line along the side of the moved first triangle.
The Second Half of Voyage
To pass .5nm from “danger”, the dividers were set to .5nm and an arc drawn around the buoy.
Lay long edges of triangles along the course line.
The course line has been drawn.
Determining Directions of a Course Line
One of the most common tasks to be done during navigation is to determine the direction of a line. It might be a course line. It might be bearing to an object. Or, you might be setting up a straight edge to draw a line. Whatever the reason, this task will be done over and over.
The Process
The first thing to ask is; “Does the “line” cross any line of longitude printed on the chart.” If it does, your job is easy and only one triangle is needed.
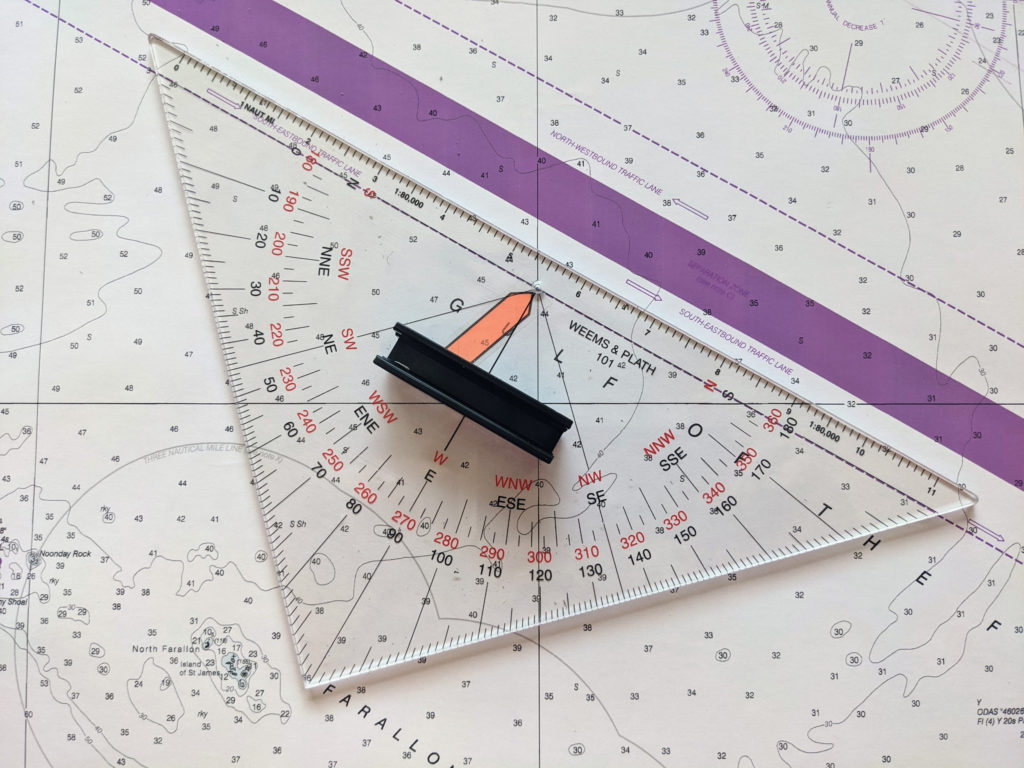
Hold the triangle’s right angle toward you.
There is a black line etched into the long side of the triangle. It is about 3/8 inch from the edge. There is a hole in the middle of the etched line. Put that hole directly on top of the spot where the line to be measured and the longitude line cross.
Rotate the triangle so the etched line is on top of line you want to measure.
Read the direction from where to line of longitude “exits” the triangle.
Remember that the triangle reads both directions the line travels. Make sure you use the correct angle, not the reciprocal. Any direction that heads east of the North/South line uses the smaller numbers. Any direction that heads west of the North/South line uses the larger numbers.
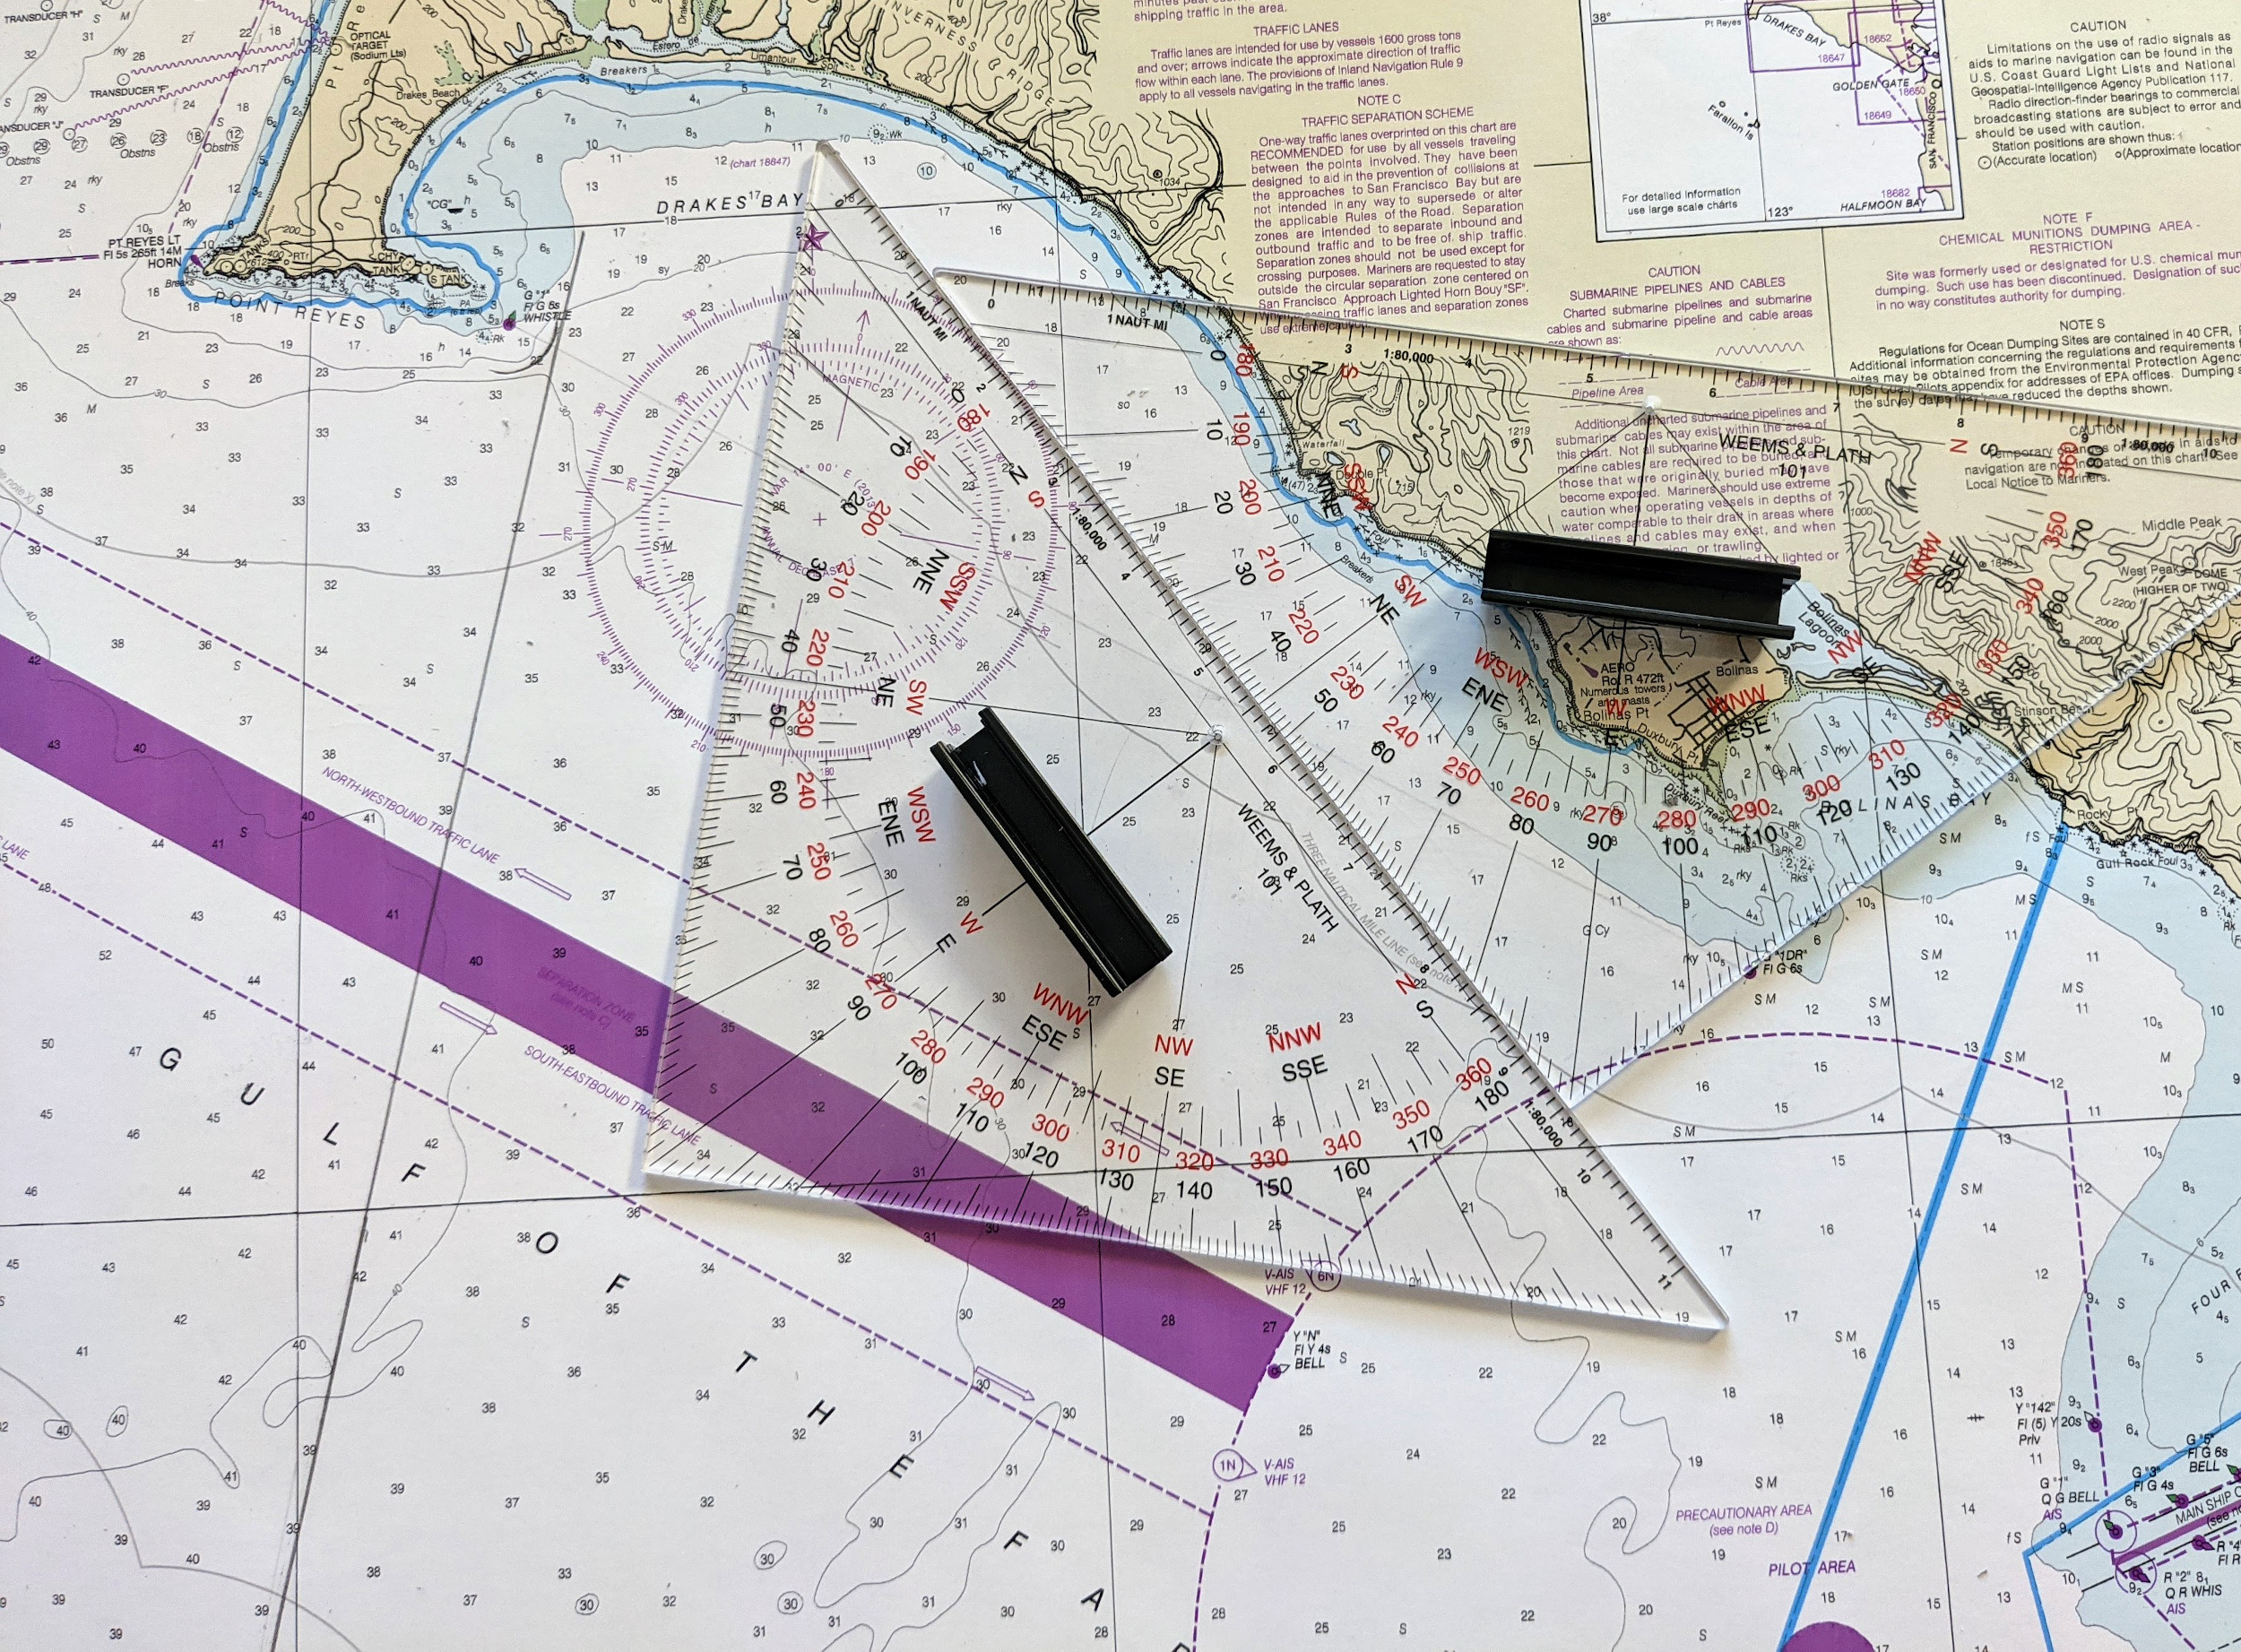
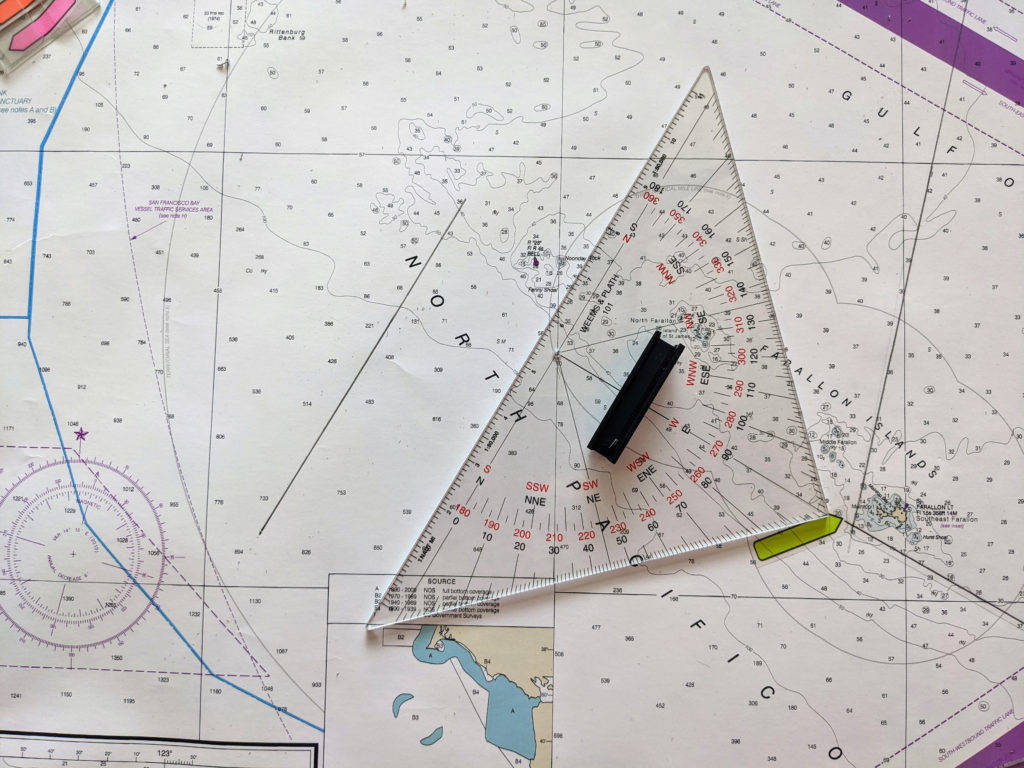
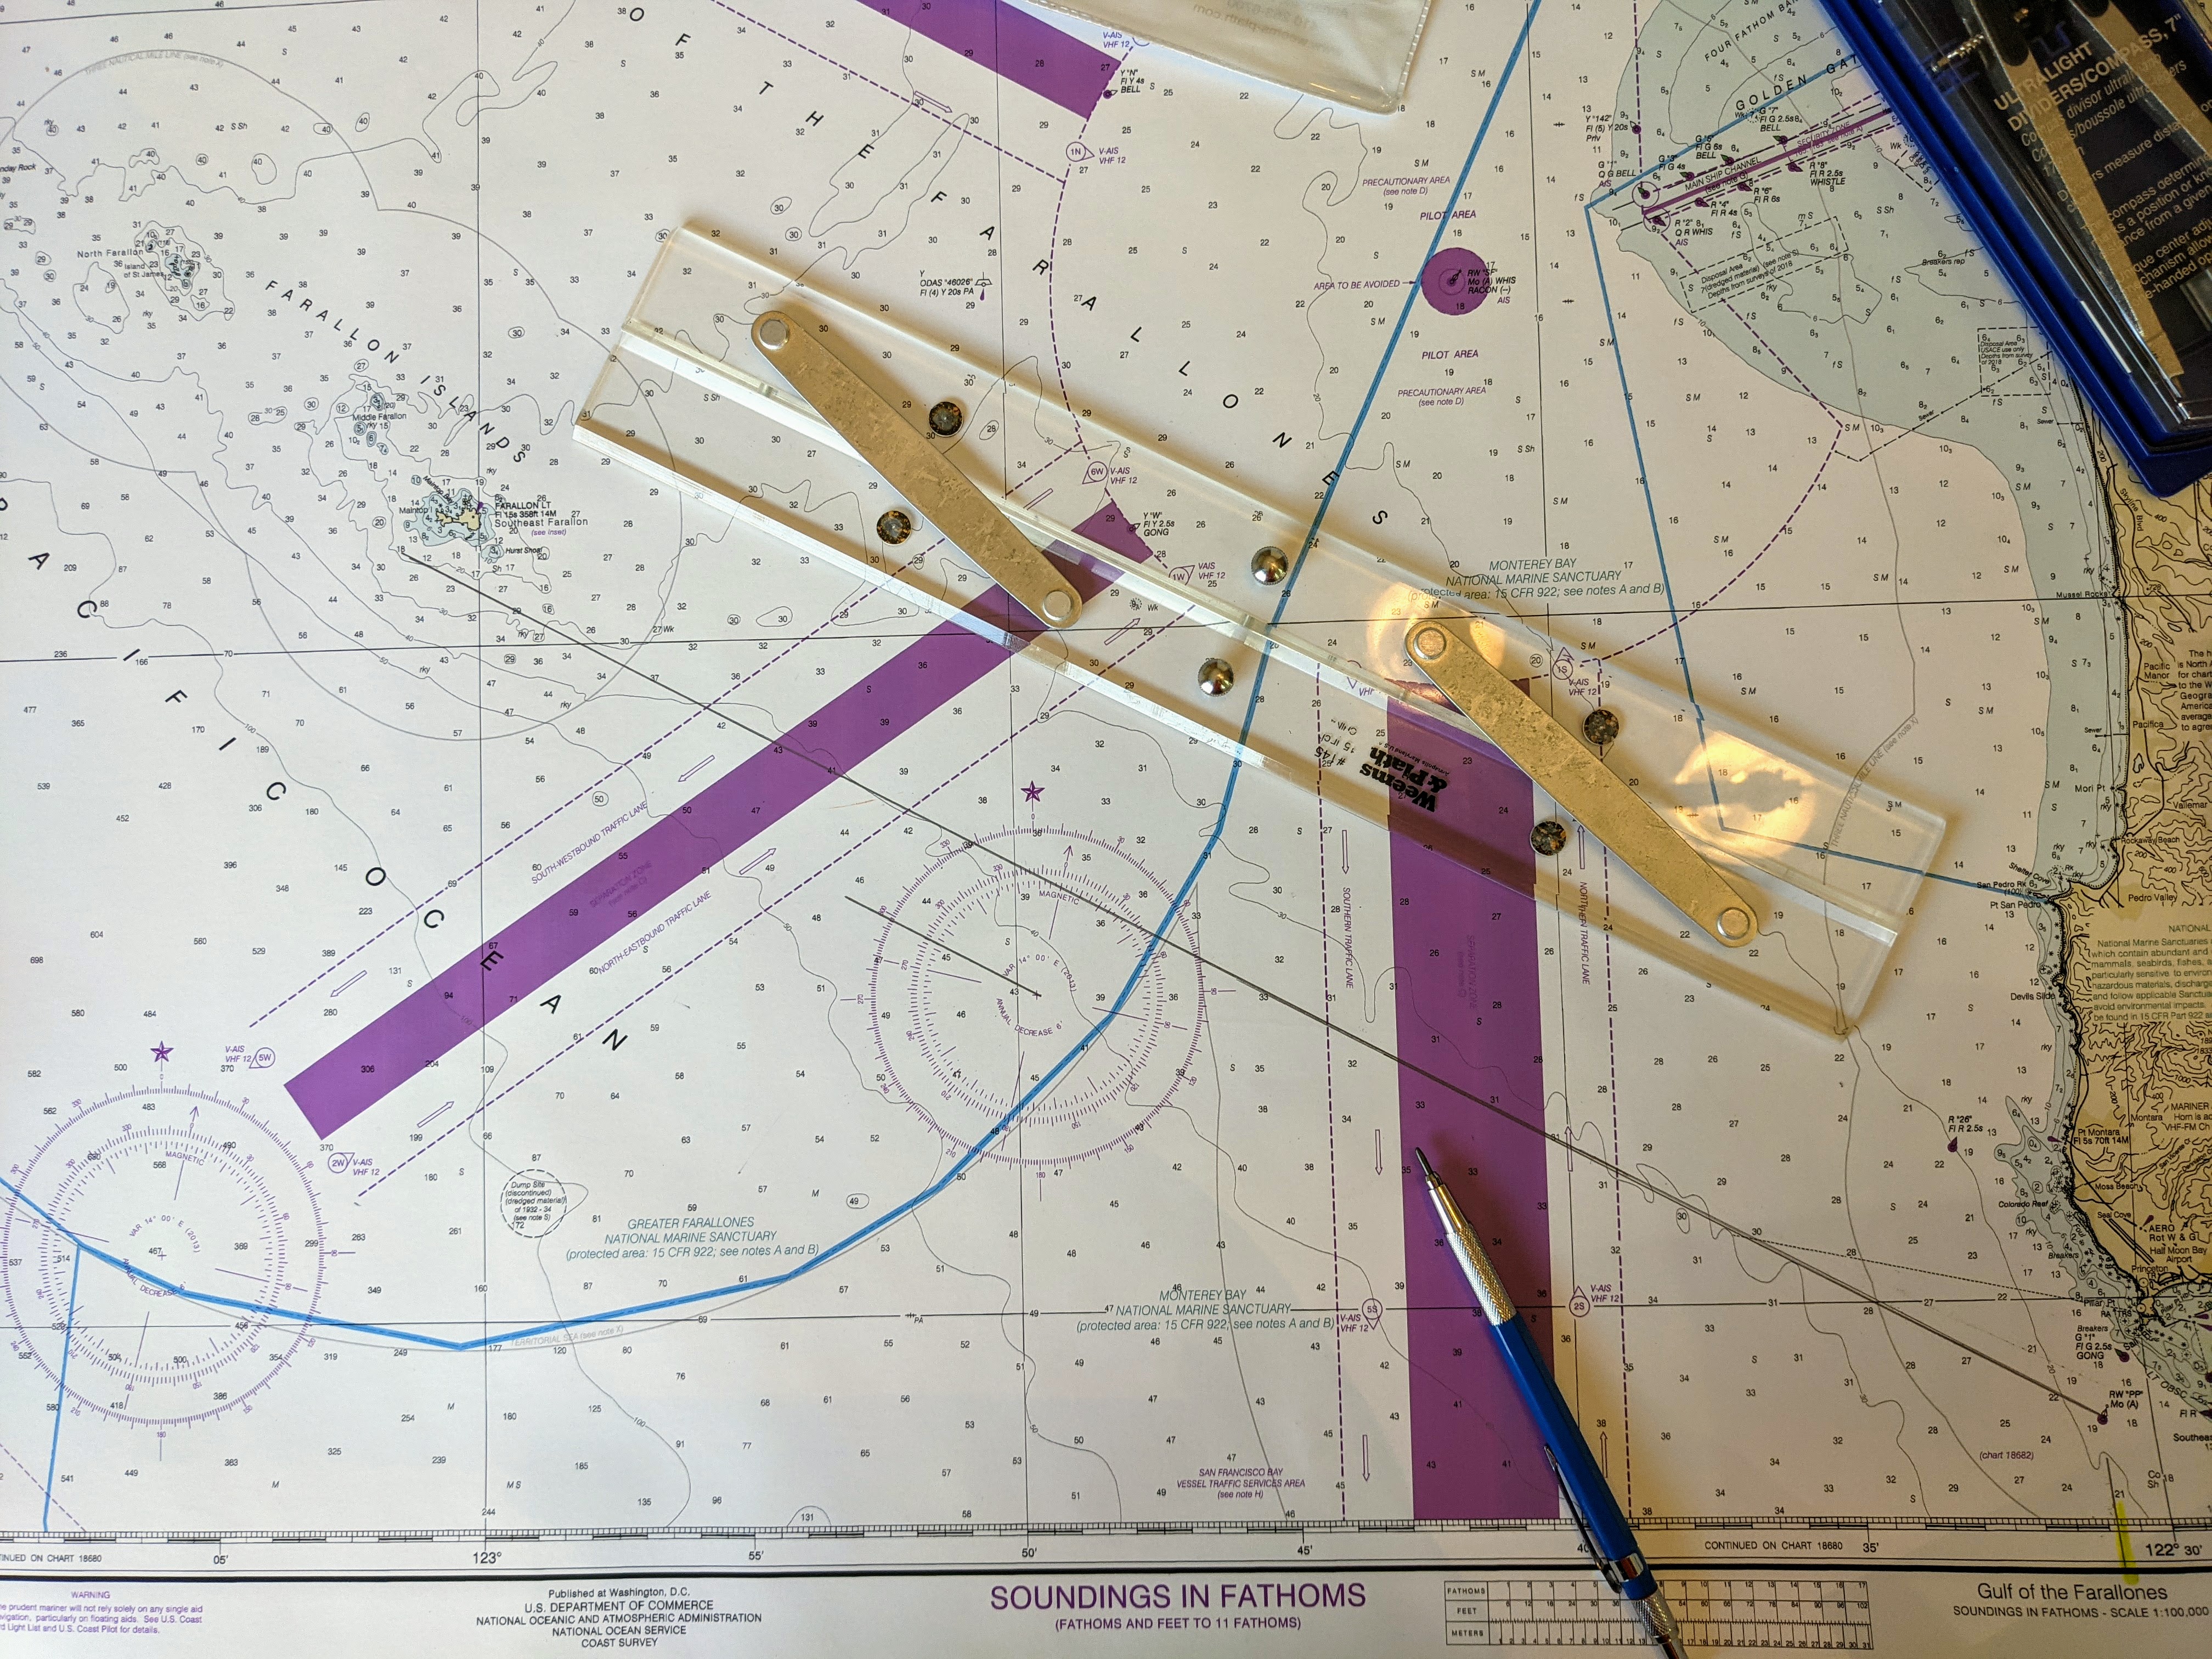
The line to be measured is the dashed purple line marking the south edge of the traffic lane. The orange arrow points to the intersection of the line and a printed line of longitude.
The pencil points to the “focal” point the the triangle. All lines come together at this point.The triangle has been placed with the “focus” point at the intersection of the line to be measured and the printed longitude line. The course is read where the longitude line exits the bottom of the triangle. In this case, 120 degrees if heading SE, or 300 degrees if heading NW.
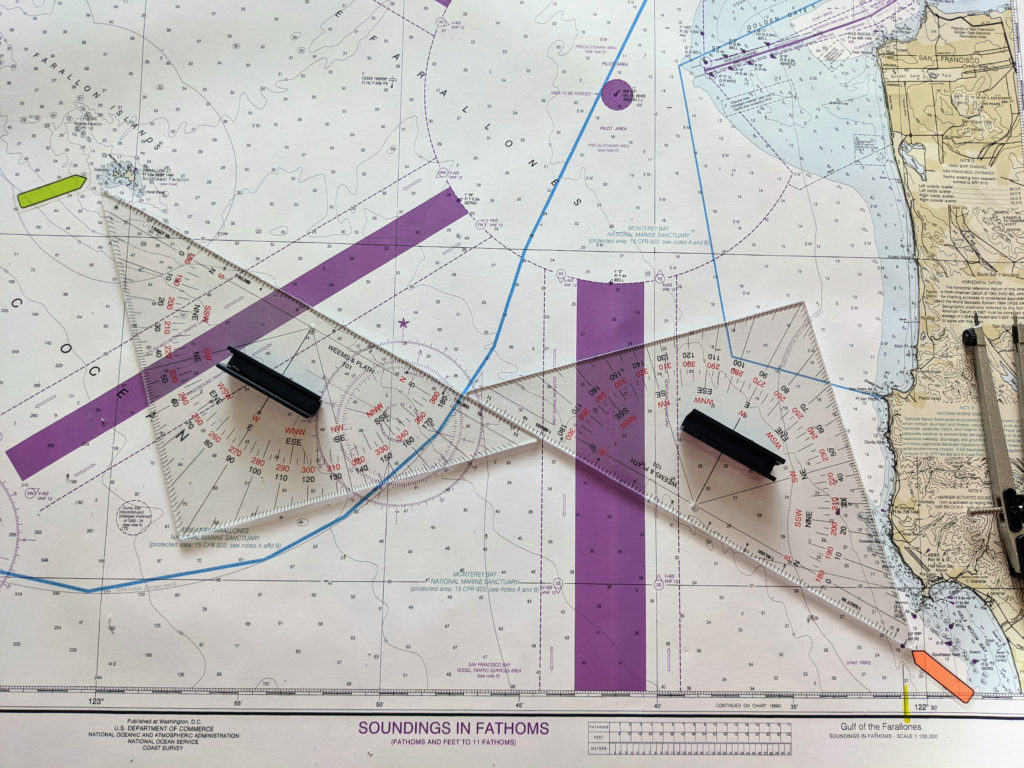
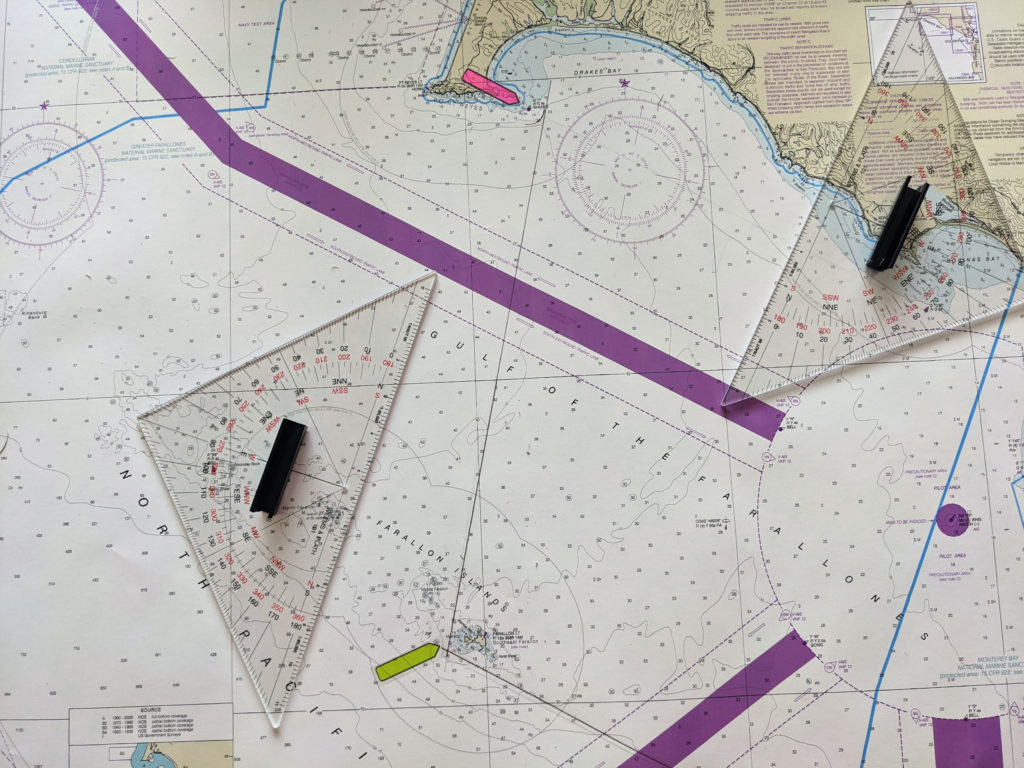
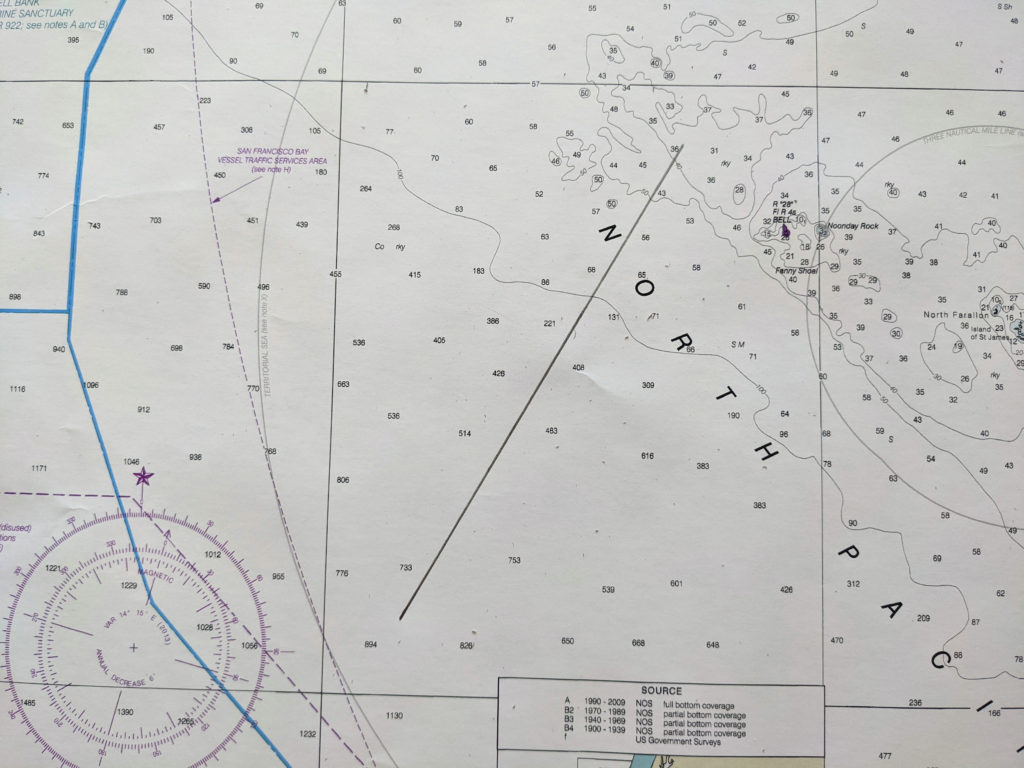
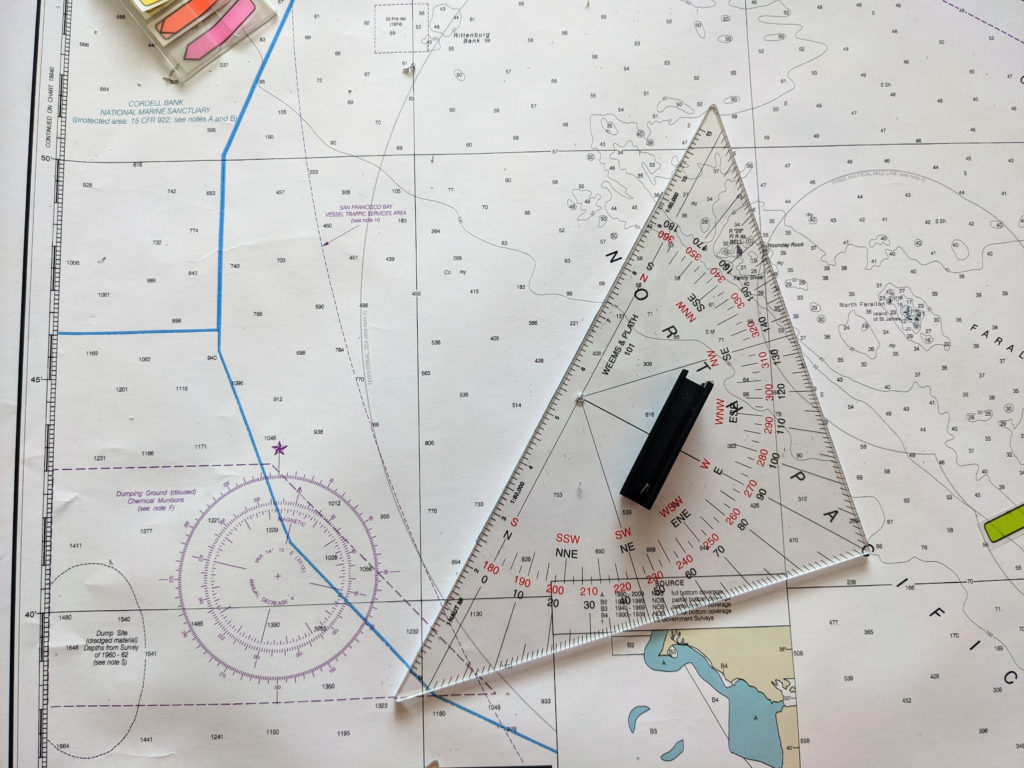
If the line does not cross a printed line of longitude two triangles are required.
Course line drawn. Does not cross a line of longitude.
Long edge of triangle lined up on course line.
Second triangle placed to support first triangle as it is moved toward line of longitude.
Triangle 1 has been slid along edge of triangle 2. Focal point has been placed on line of longitude.
Course is easily read as either 030 or 210 degrees depending on direction of travel.
Tangents (aka: How do I Know When I am Abeam an Object?)
There are occasions when it is beneficial to know at what point you will be abeam a specific object. With triangles, this is a snap. Simply lay the long edge of the triangle on the course line. Butt the 90° angle of the second triangle against the first and move it so the other short edge passes through the object.
Triangles and the Compass Rose
When using navigation triangles, the compass rose found on every chart is only used for one thing. To determine variation. Since you will not be “walking” the course/bearing line over to the compass rose, you can not use it to determine magnetic directions.
When using navigation triangles, all directions will be in degrees true. Calculations must be done to convert to “magnetic” or “per ship’s compass”. If you need a refresher on how, help can be found at TVMDC.
Help to Remember How to Find Courses and Bearings
Using navigation triangles can be a bit frustrating at first. Here are two pieces of advice to help you during the learning process.
To find the direction of a course line, first lay the black course line on the triangle on the drawn line, then use a straight edge to move the triangle’s focal point to a line of longitude.
To draw a specific course or bearing line, first find the correct direction by placing the focal point on a longitude line and rotating the triangle, then use a straight edge to move the triangle to the bearing object or course starting point.
Put Another Way
If you know the bearing, locate the bearing and move to the line.
If you know the line, locate the line and move to a longitude line to find the bearing.
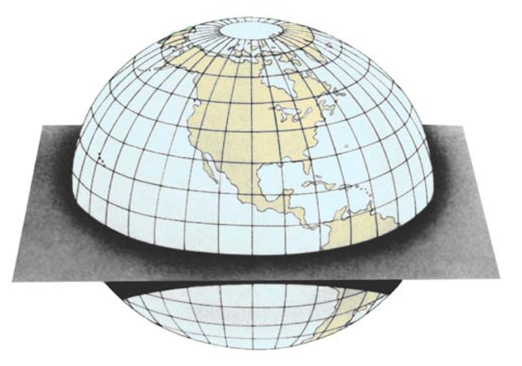
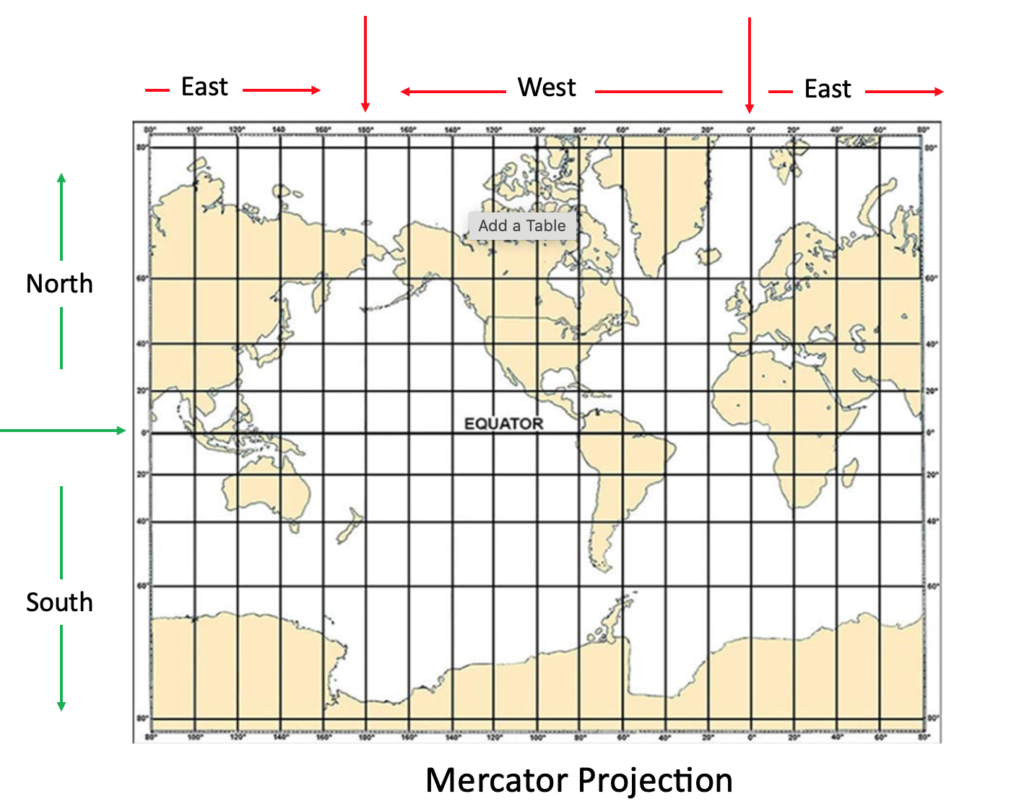
Lines of latitude run east and west (across the chart). Lines of longitude run north and south (up and down).
Degrees of Latitude
Zero degrees of latitude is known as the equator. Latitude goes from zero degrees to 90 degrees north and south of the equator. As can be seen in the image above, Lines of latitude run parallel to each other. There are 60 nautical miles between each degree of latitude. Lines of latitude are a consistent distance apart, so they can be used to measure distance.
One degree of latitude can be divided into 60 “minutes”. Each minute of latitude is one nautical mile.
A minute of latitude can be further divided into 60 seconds. However, it is more common today to divide minutes into tenths and hundredths of a minute. The chart examples below all degrees, minutes, and tens of a minute for both latitude and longitude.
Degrees of Longitude
Zero degrees longitude (also known as the prime meridian) runs through Greenwich England. Longitude goes from zero degrees to 180 degrees east and west of Greenwich England. At the equator lines of longitude are about 60 miles from one degree to the next, however, as can be seen in the image, lines of longitude come together at the poles so they can not be used to measure distance.
A degree of longitude an be divided into 60 minutes and 60 seconds (or into tenths and/or hundredths).
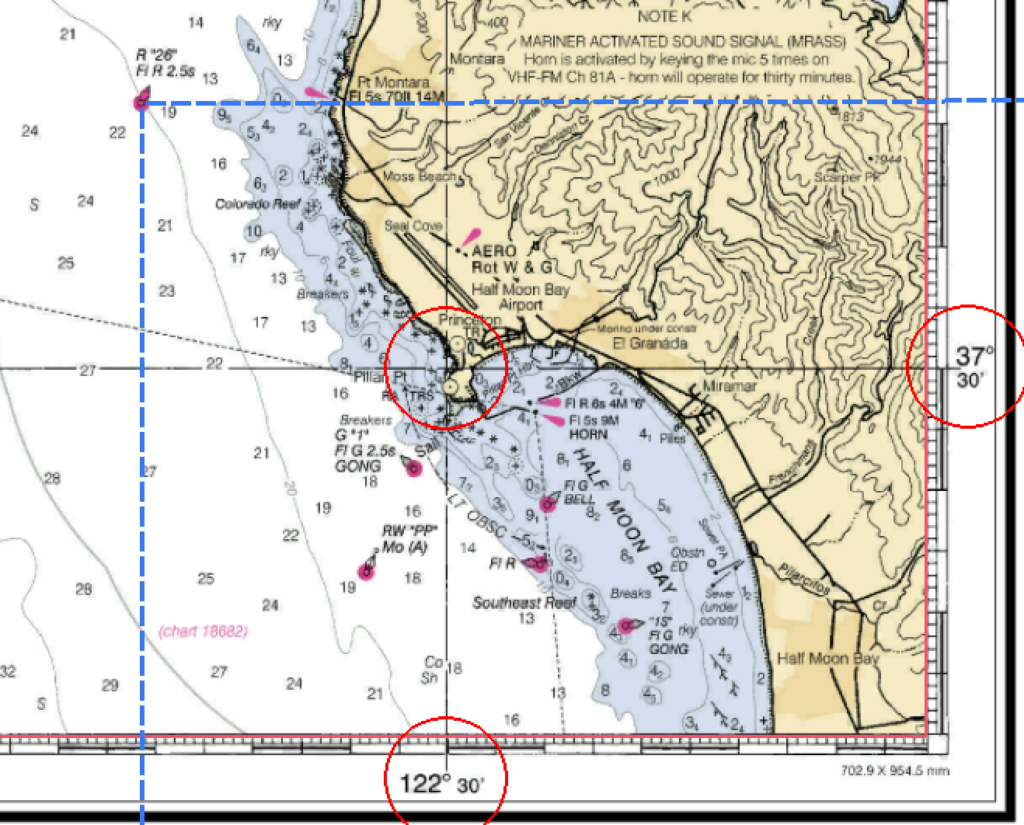
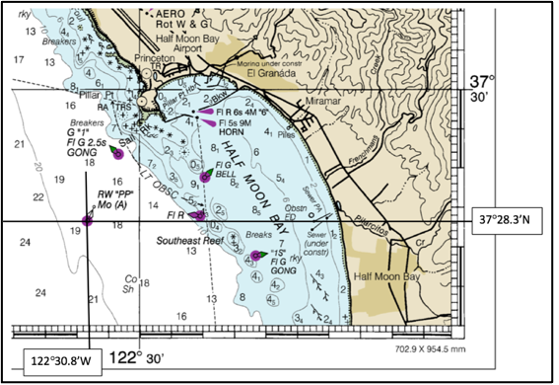
Finding the location of Half Moon Bay
Putting this information together, the latitude and longitude of Half Moon Bay near San Francisco is 37° 30′ N and 122° 30′ W. Which means 37 degrees 30 minutes north of the equator and 122 degrees 30 minutes west of Greenwich England.
First Lat Long Exercise
Use the dashed blue lines to find the latitude and longitude of the buoy named R”26″ Fl R 2.5s.
The Lat and Long of the point north of Half Moon Bay is approximately 37° 30′ N and 122° 30′ W.
Parallel Rule
One navigation tool you will use a lot is the parallel rule. It is two straight edged “rulers” placed side by side and connected with hinges. These hinges allow you to separate the rulers, moving them further apart, while staying perfectly parallel with each other. Using them, you can “walk” a line from one location on the chart to another, and know that the line is parallel to the original line.
Charts have “major” latitude and longitude lines printed directly on the chart for reference. In the case of the chart image above, latitude 37° 30′ and 122° 30′ have been printed in black on the face of the chart.
To use a parallel rule, line one of the outside edges along a printed line of latitude or a line of longitude. Hold that side rule firmly in place and separate the two rulers, “walking” it up to the object you are concerned with. In the case above, buoy R”26″.
Draw a line from the “object” to the latitude scale to find the latitude of that object.
Repeat the process using a line of longitude to come up with the latitude and longitude of that object.
Finding an Object or Location at a Known Latitude/Longitude
The parallel rule can also be used to find an object or location on the chart when only the latitude and longitude are known.
The given latitude and longitude of 37° 28.3′ N and 122° 30.9′ have been highlighted.
Set up the parallel ruler on the printed latitude line.
Hold one firmly rule in place while the other is moved down the page to line up with the highlighted latitude.
Repeat with a line of longitude and the highlighted longitude. The object, in this case buoy RW”PP” should be found at the intersection of these two lines.
Latitude and Longitude/Parallel Rule Exercise
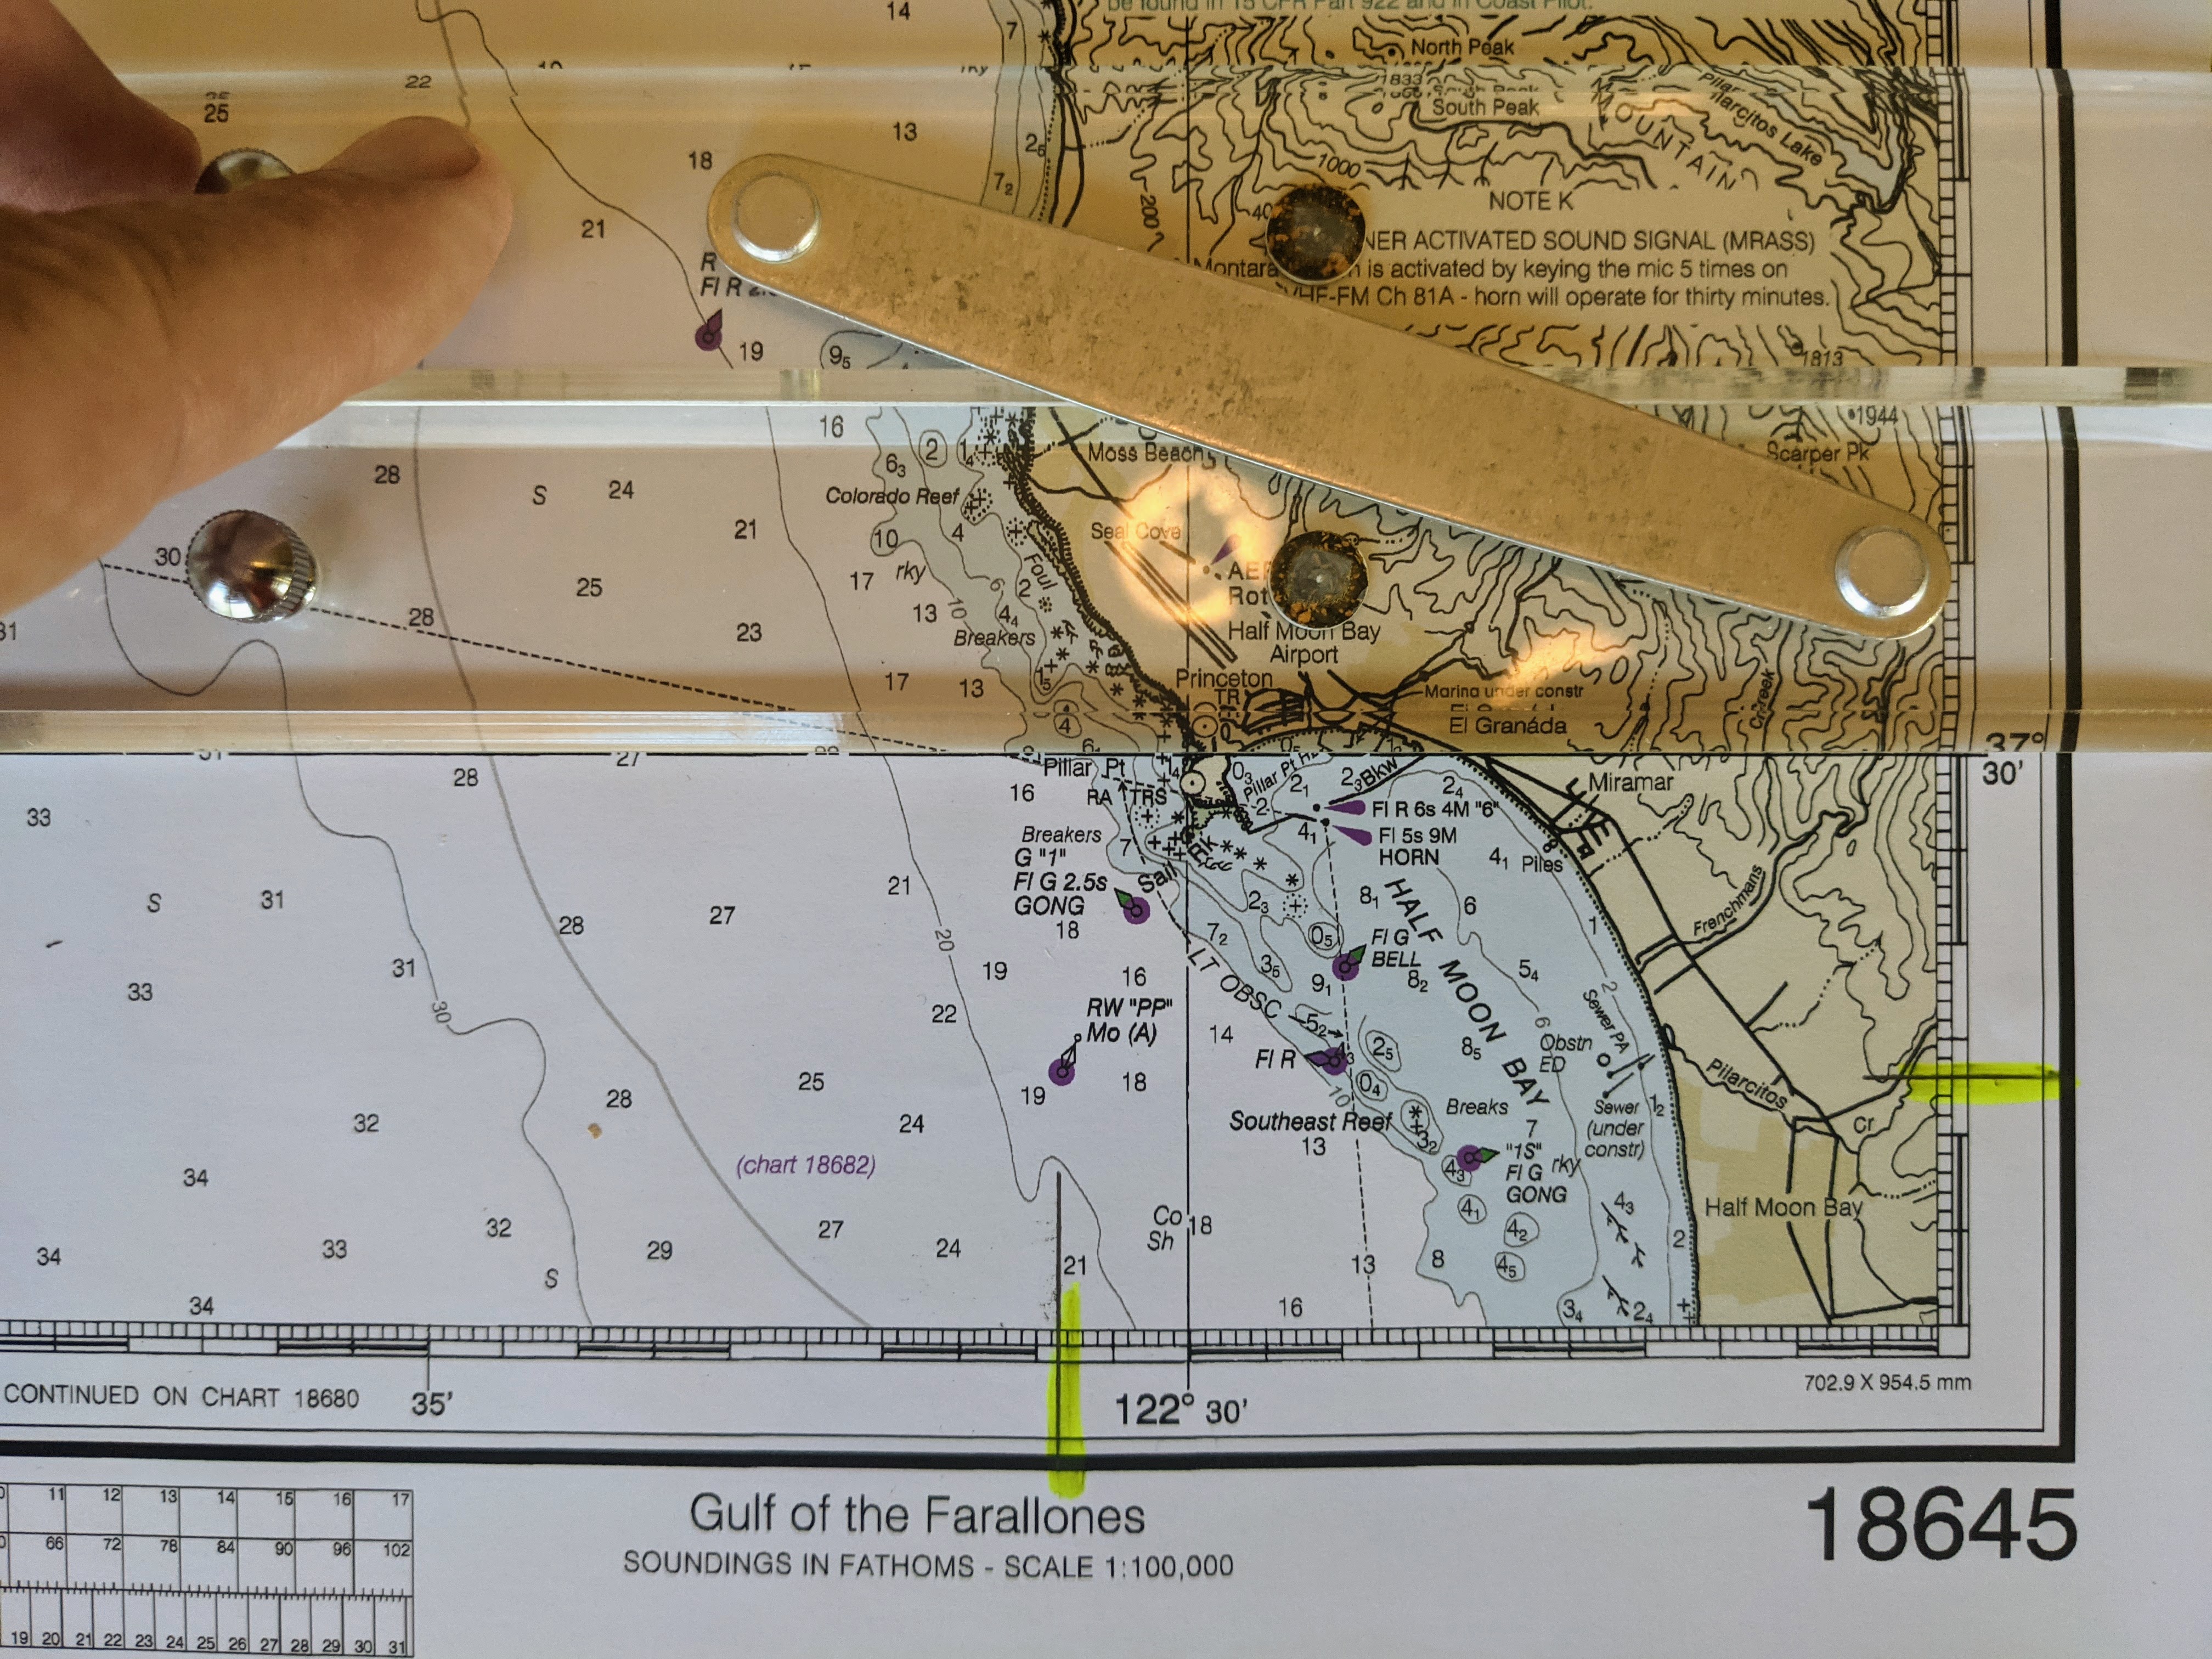
Download and print the attached portion of chart 18645 for an exercise in finding latitude and longitude.
Course and/or direction is also found using the parallel rule. Simply lay one edge of the rule from one point to the next and draw a line between the two points. Hold one side of the rule in place and walk the other side to the “+” located in the center of the compass rose. Mark the course.
Lay the parallel rule along the course of travel. In this case, from RW”PP” near Half Moon Bay to the Farallon Islands.
Draw a line along the direction of travel.
Hold one side of the parallel rule in place and move the other side to the small “+” in the center of the nearest compass rose.
Mark the course along the degree scale of the rose.
Here is a close up image of the compass rose showing course line and the the degrees both marked. In this case, the course is between 298 and 299 degrees.
Always make sure your course is marked in the same direction from the center of the rose as your direction of travel!
Course Exercise
Use the chart you downloaded and printed earlier.
Assuming that you have found the two buoys, lay one edge of the parallel rule between them. Draw a pencil line.
Now, hold the side of the rule in place that connects the buoys and move the other rule to the small + in the middle of the compass rose. Where the parallel rule “exits” the compass rose is the direction (or course) from one buoy to the other. Caution – if you are traveling from point A to point B, the course will be in the same direction of travel from the + to the outer ring of the compass rose.
Distance is calculated by comparing the distance between two points with the latitude scale. The easiest way to do this is by using dividers.
The dividers are set to 5 minutes of latitude. Remember, each minute of latitude equals 1 nautical mile.
“Walk” the dividers along the course line. Most likely the last step will be past the end point. Narrow the dividers down to stop at the end point and compare this measurement with the latitude scale. The distance is the combined total of all the “steps” of walking the dividers.
Distance Exercise
What is the distance from Point A to Point B on the downloaded chart?
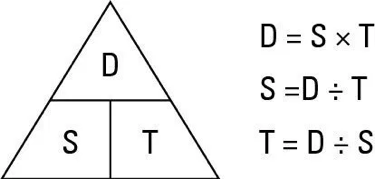
The relationship between Distance Speed and Time is critical in navigation. If you know any two them, the third can be easily calculated.
Distance divided by Speed Equals Time (in hours and tenths of an hour)
Distance divided by Time Equals Speed
Speed multiplied by Time Equals Distance
D Street Triangle
An easy way to remember these equations is by using the “D Street” Triangle. The horizontal line means divided by. The vertical line means multiply.
Using the results of the last exercise. If you travel from Point A to Point B you have traveled 14.4 miles. If it took you 3.1 hours (which is 3 hours and 6 minutes) the equation would look like:
14.4/3.1 = 4.6 knots
Let’s take the same situation, but this time assume your boat speed is 6 knots. How long will it take to travel the 14.4 miles?
If you leave at 10:00AM, what is your estimated time of arrival?
On a boat, fuel consumption is referenced as Gallons Per Hour. Here is a hint for you on fuel consumption calculations. Per always means divided by when used in a math equation.
If you use 3.75 gallons of fuel over a 5 hour period of time. Your GPH is 3.75 / 5 = .75 gallons per hour
Using the same reasoning, GPH times the hours underway equals the total fuel used. .75 GPH for 12 hours equals 9 gallons of fuel used.
F / T = GPH
GPH * T = F
F / GPH = T
If your boat consumes .6 gallons per hour, how much fuel would you use traveling from Point A to Point B in the above example?
If you have a 30 gallon tank and you want to keep a minimum of 25% in reserve, how much usable fuel do you have?
Based on that amount of usable fuel, how long can you motor at .6 GPH?
At a boat speed of 5 knots, how far will you travel during that time?
In this topic, we discuss “Lines of Position.” A line of position (LOP) is a “line” to or around a target object. When an LOP is determined, you must be somewhere on that line. Because of this two LOPs provides an exact location. In other words, if you are somewhere along each of two different LOPs, you must be located at the intersection. In this case, “X” marks the spot.
An LOP can be found a number of different ways.
Bearing to an object
A Range (two objects in line with each other)
Depth contour line on a chart
Distance Off an Object
Angle off the bow (AKA Relative Bearing)
Radar Range
Advancing a previous LOP (called a running fix)
Use one or more LOP types to generate an accurate location, also known as a fix.
Each type of LOP is looked at in more detail below.
Label the LOP
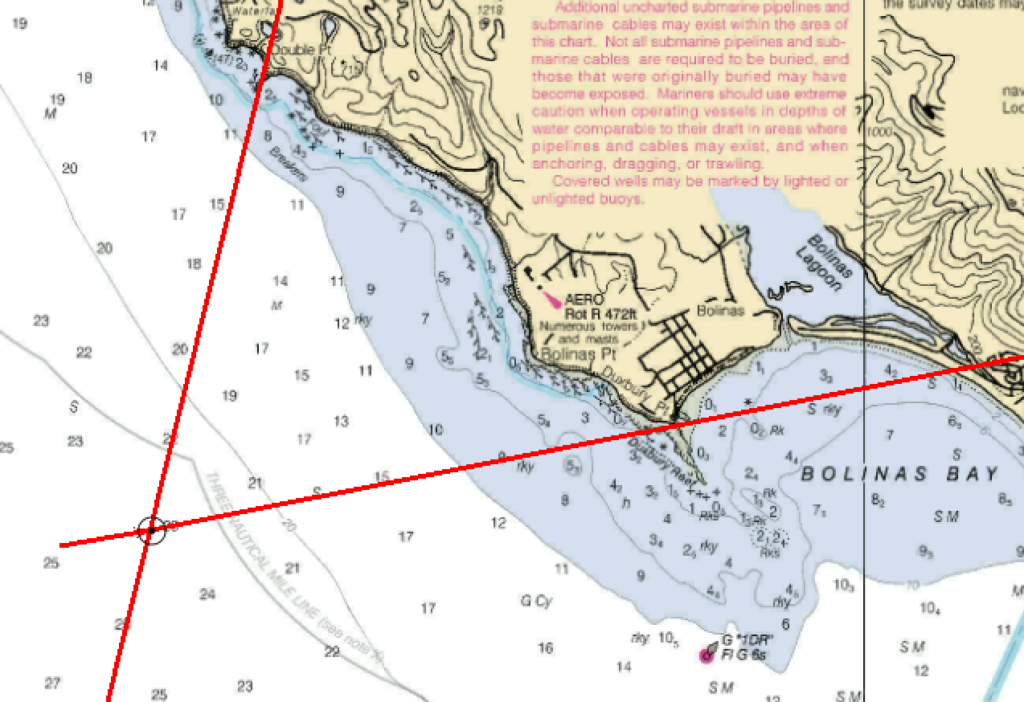
On a chart, every LOP must be labeled with time, direction, distance, etc. The two examples above have not been labeled for the sake of simplicity.
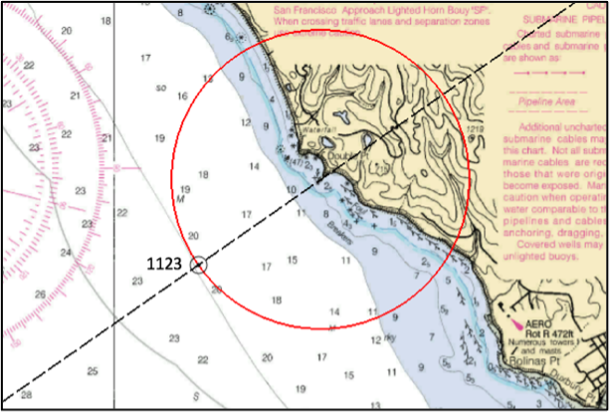
Two plotted lines of position. The first to Double Point. The second to Duxbury Point. Where the two LOPs cross is your position. Also known as a fix, it is marked on the chart with a circled dot.The same LOP by bearing to Double Point combined with a distance off LOP (aka Circle of Position).
Magnetic vs. True Labels Pick one and stay with it.
Bearing to an Object
Probably the most common, and easiest to obtain is the “bearing to an object.” The target can be any object which can be accurately identified visually and on a chart. For example, a lighthouse, point of land, rock, or tower might all be used.
Generally, use a handheld compass to obtain the bearing. Other possibilities include radar or the ships compass.
Label a bearing to an object above the bearing line with time and direction (in degrees). Always write time using 24 hour notation. You may label direction in degrees magnetic if a magnetic compass is used. If so, mark the bearing with the letter “M”. On the other hand, you may also choose to label in true.
For example: B 045M 1029 Or: B 032T 1029
Range
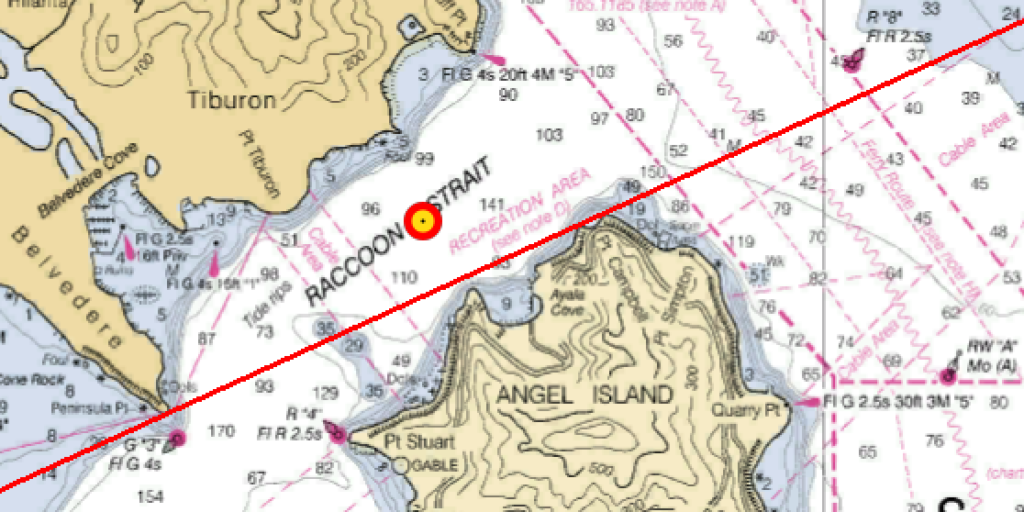
A range is two objects in perfect alignment with each other. In this case, Pt Campbell on Angel Island and Peninsula Pt in Belvedere are visually aligned. As a result, you can be confident you are somewhere on that line.
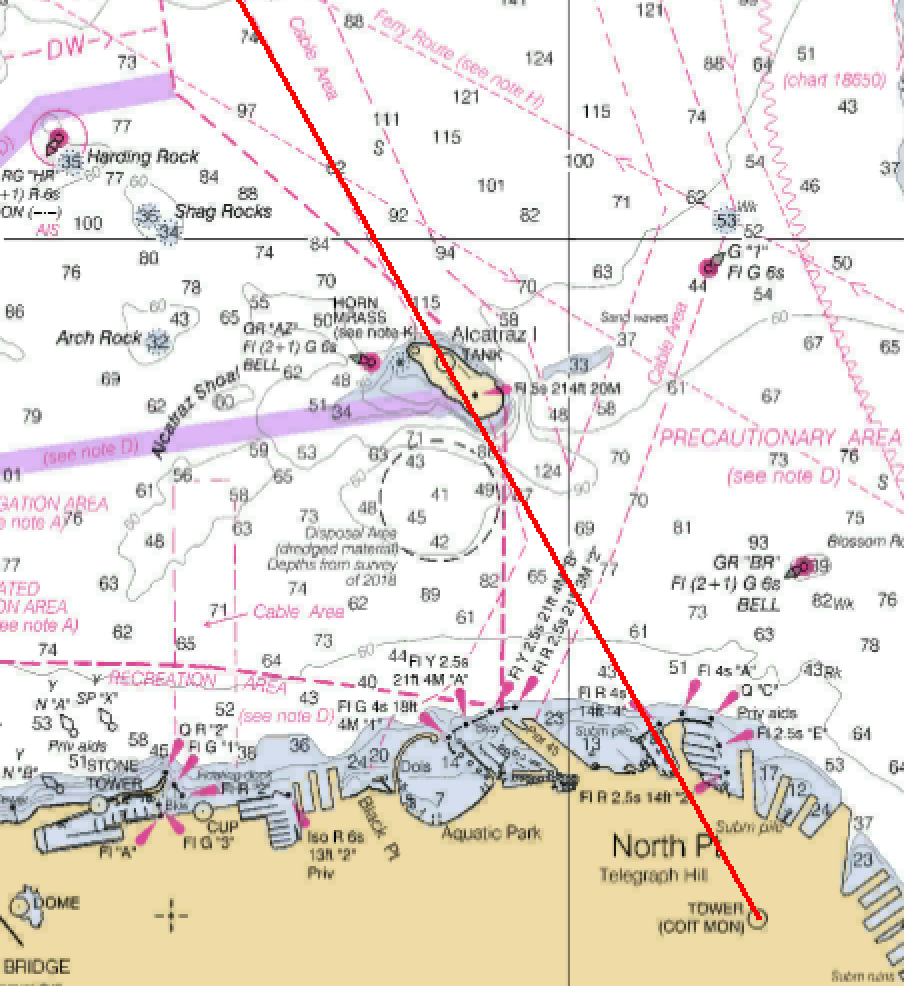
In the second example, the Alcatraz Island tank and Coit Tower are in range. You must be north of Alcatraz, somewhere on the red line.
Label range LOPs with the time.
Ranges are often set up with the goal of assisting vessel navigation.
Two lights set at different heights have intentionally been placed in range at the end of the Point Potrero Reach to provide a line of position along the center of the dredged channel.
Depth Contour Line
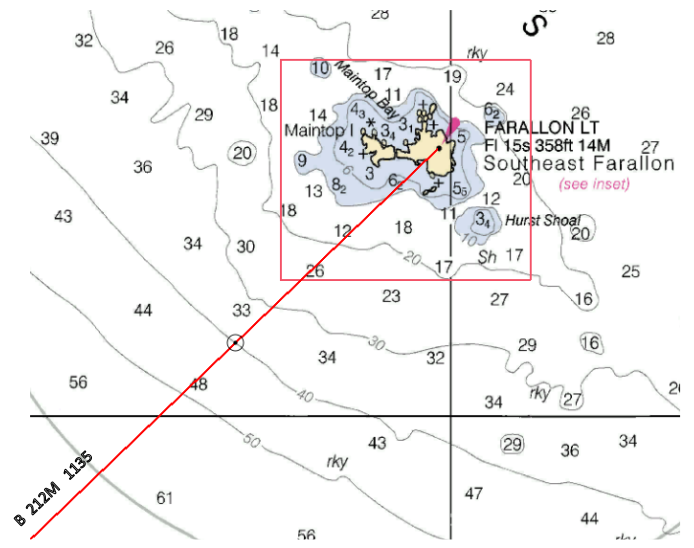
Depth contours approaching Southeast Farallon.
Do you have an accurate depth sounder? If so, the chart may be able to provide you with a pre-printed LOP.
Combining a bearing to an object and a depth reading provides a location fix. Here, a 212M bearing to Farallon Lt taken at 1135 is plotted and compared to a depth sounding of 240 feet (40 fathoms)
The resulting fix places you 1.9 miles from Southeast Farallon Island.
Distance Off
Use relative bearings and their change over time to calculate distance off.
Relative Bearings
A relative bearing is the angle to an object relative to the heading of the boat. If your boat is traveling in a direction of 145T, and the bearing to an object is 100T, its relative bearing to you is 045°. This is the perfect scenario to determine distance off.
Double the Angle Off the Bow
Continue on the same heading watching the relative bearing to the object change over time. When the relative bearing is 090° determine the time required to travel from 045° to 090° relative.
Calculate the distance traveled during this time. The distance travelled is equal to the distance off the object at the time of the second bearing. This process works with any doubling of the angle off the bow.
If the relative angles are 045 and 090, it is also known as a “four-point bearing fix.”.
In the figure shown, assume it took 23 minutes to travel from point A to point B.
Using distance equals speed x time, at 5 knots, 23 minutes (.38 hours) indicates a distance travelled of 1.9nm (5 x .38 = 1.9). Therefore, the distance from B to T is 1.9nm.
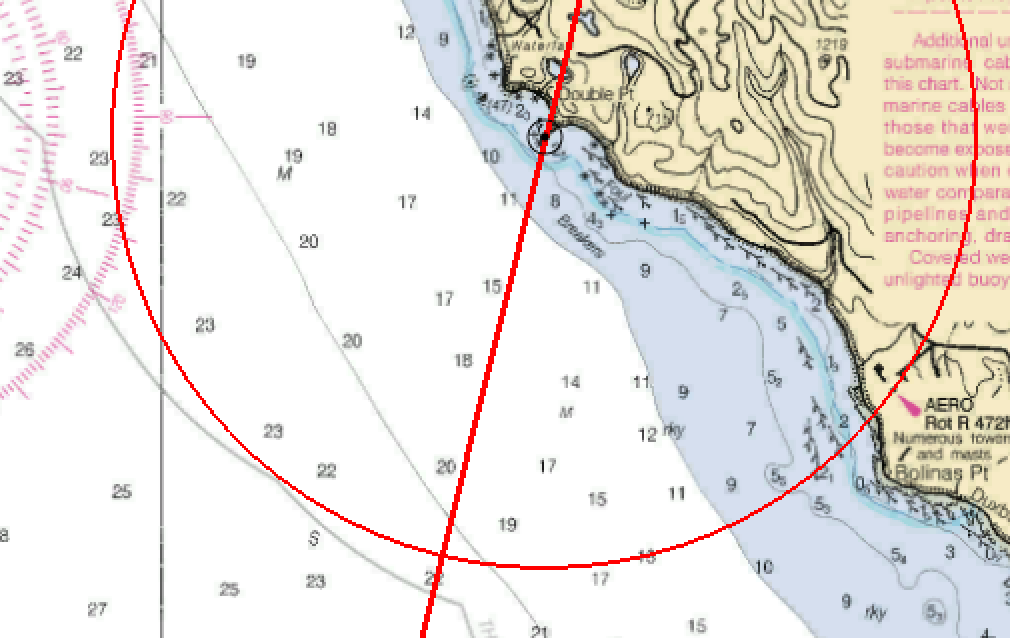
Circles Can Be Lines of Position
Now, set a divider with a pencil lead at a distance of 1.9nm and scribe a circle (or a portion of a circle) around your target.
The scribed circle is your LOP.
Added to the LOP created by the bearing of 055T to the target, you have established a location fix.
Know where 045 and 090 relative align with a spot on your vessel. For example, maybe the back edge of a winch lines up at 045 degrees when you are standing at the helm. Knowing this, it is easy to calculate 045 degrees relative at a glance, and you can make distance off estimates can be done at any time without going below or doing complicated calculations. Simply note the distance (or time and speed) traveled from 045R to 090R and you are done.
Radar
Radar, excels in providing the distance to an object. If available use it regularly.
Advancing an LOP
Advancing a line of position results in something called a running fix which is covered in detail in a separate topic.
To advance an LOP, simply follow your course line the distance you have traveled over a period of time. Now, take an old LOP and move it that distance. The advanced LOP can now be used with a new LOP to provide a fix.
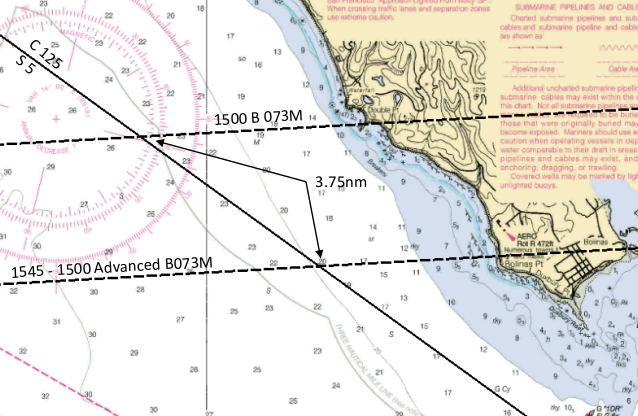
The original bearing of 073 was taken at 1500. A vessel traveling at 5kts advances 3.75nm during 45 mins.
The advanced LOP is drawn parallel to the 1500 LOP, 3.75nm along the course line.
The method of determining location used by a mariner is latitude and longitude.
Parallels – Lines of Latitude
Lines of latitude run East/West marking off the degrees of an arc between the equator and each of the geographic poles.
The equator is 0°.
The North Pole is 90°N and the South Pole is 90°S.
Lines of latitude are also known as “parallels” owing to the fact that they run parallel to each other moving up and down the globe.
Meridians – Lines of Longitude
Lines of longitude, also known as “meridians”, run North/South, beginning at one pole, and terminating at the other.
As with any sphere, there are 360° around the Earth. In the case of meridians, the 360° degrees are divided into two segments of 180° moving east or west from the Prime Meridian which runs from pole to pole through Greenwich England.
Degrees North, South, East, & West
Latitude is expressed in degrees from 0 to 90 N or S.
Longitude in degrees 0 to 180 E or W.
Distance in Degrees
One degree of latitude equals a distance of 60 nautical miles and since latitude lines are parallel to each other, remains the same no matter the location on the Earth.
Longitude on the other hand has a distance between degrees at the equator of approximately 60 nautical miles, but converges as they move toward the poles, eventually meeting at the North and South Poles.
Each degree can be divided into 60 minutes. A minute of latitude equals one nautical mile. A minute can be further divided into 60 seconds with a second of latitude representing approximately 101 feet.
Accurately knowing your latitude and longitude to the second places your location on the Earth within about 100 feet.
Modern Convention
Modern convention is shifting away from using seconds, instead, using minutes and thousandths of minutes, called decimal minutes, with 1/1000th of a minute being equal to about 6 feet, or decimal degrees shown to the 4th or 5th decimal place.
An important point to keep in mind is that while theory or GPS may be able to provide accuracy of 6 feet, practical use of a chart limits accuracy to about .1 minute (about 600 feet).
Notation
I’m sure by now you have noticed how cumbersome it is to use the words degrees, minutes, and seconds. These words are rarely, if ever, written out by the navigator. Instead, these symbols are used:
° for degrees
‘ for minutes
“ for seconds
4 Ways to Say the Same Location
37 degrees 45 minutes 00 seconds North by 122 degrees 41 minutes 34 seconds West.
37°45’00” N, 122°41’34” W.
37°45.000’ N, 122°41.567’ W.
37.75000° N, 122.69278° W.
Deciding which format to use is a matter of personal preference.
Converting Minutes and Seconds to Thousandths of a Degree
The disadvantage of using decimal minutes is that many charts are set up in minute-second format. To convert seconds to decimal minutes, simply divide the number of seconds by 60. Multiplying thousandths by 60 will provide seconds.
Finding Latitude and Longitude
Finding the latitude and longitude of a position on a chart is a simple matter of drawing a horizontal line from the location to the latitude scale, and a vertical line from the position to the longitude scale, then reading the location from the scale.
As shown here, buoy RW “PP” Mo (A), the safe water approach buoy outside Pillar Point Harbor near Half Moon Bay, California is 37°28.3’N, 122°30.8’W.
Horizontal and vertical lines are draw using the printed latitude and longitude lines provided on every chart. In the example shown, parallel rule could be lined up along latitude 37°30’ then moved down to line up with the buoy and a line draw to the scale. Similarly, the rule would be lined up with longitude 122°30’ and move over to the buoy, another line drawn, and the location read from the two scales.
This portion of the Gulf of the Farallones chart provides an example of the latitude and longitude scales along the top and right side.
37° 32.2′ N and 122° 33.1′ W.
37° 59.0′ N; 122° 57.3′ W ……….. G”1″ Fl G 6s WHISTLE
37° 51.6′ N; 122° 41.7′ W ……….. G”1DR” FL G 6S
121° or 122°
14.4 nm (nautical miles)
14.3 / 6 = 2.4 hours
2.4 hours equals 2 hours and 24 minutes (2:24)
You should arrive at (your ETA) approximately 12:24PM
10:00 + 2:24 = 12:24
.6 GPH x 2.4 hours equals
.6 x 2.4 = 1.44 gallons of fuel used.
30 gallon tank with 25% reserve equals
30 x .25 = 7.5 gallon reserve … 30 – 7.5 equals 22.5 gallons of usable fuel.