-
“Sunset” of the NOAA Raster Chart
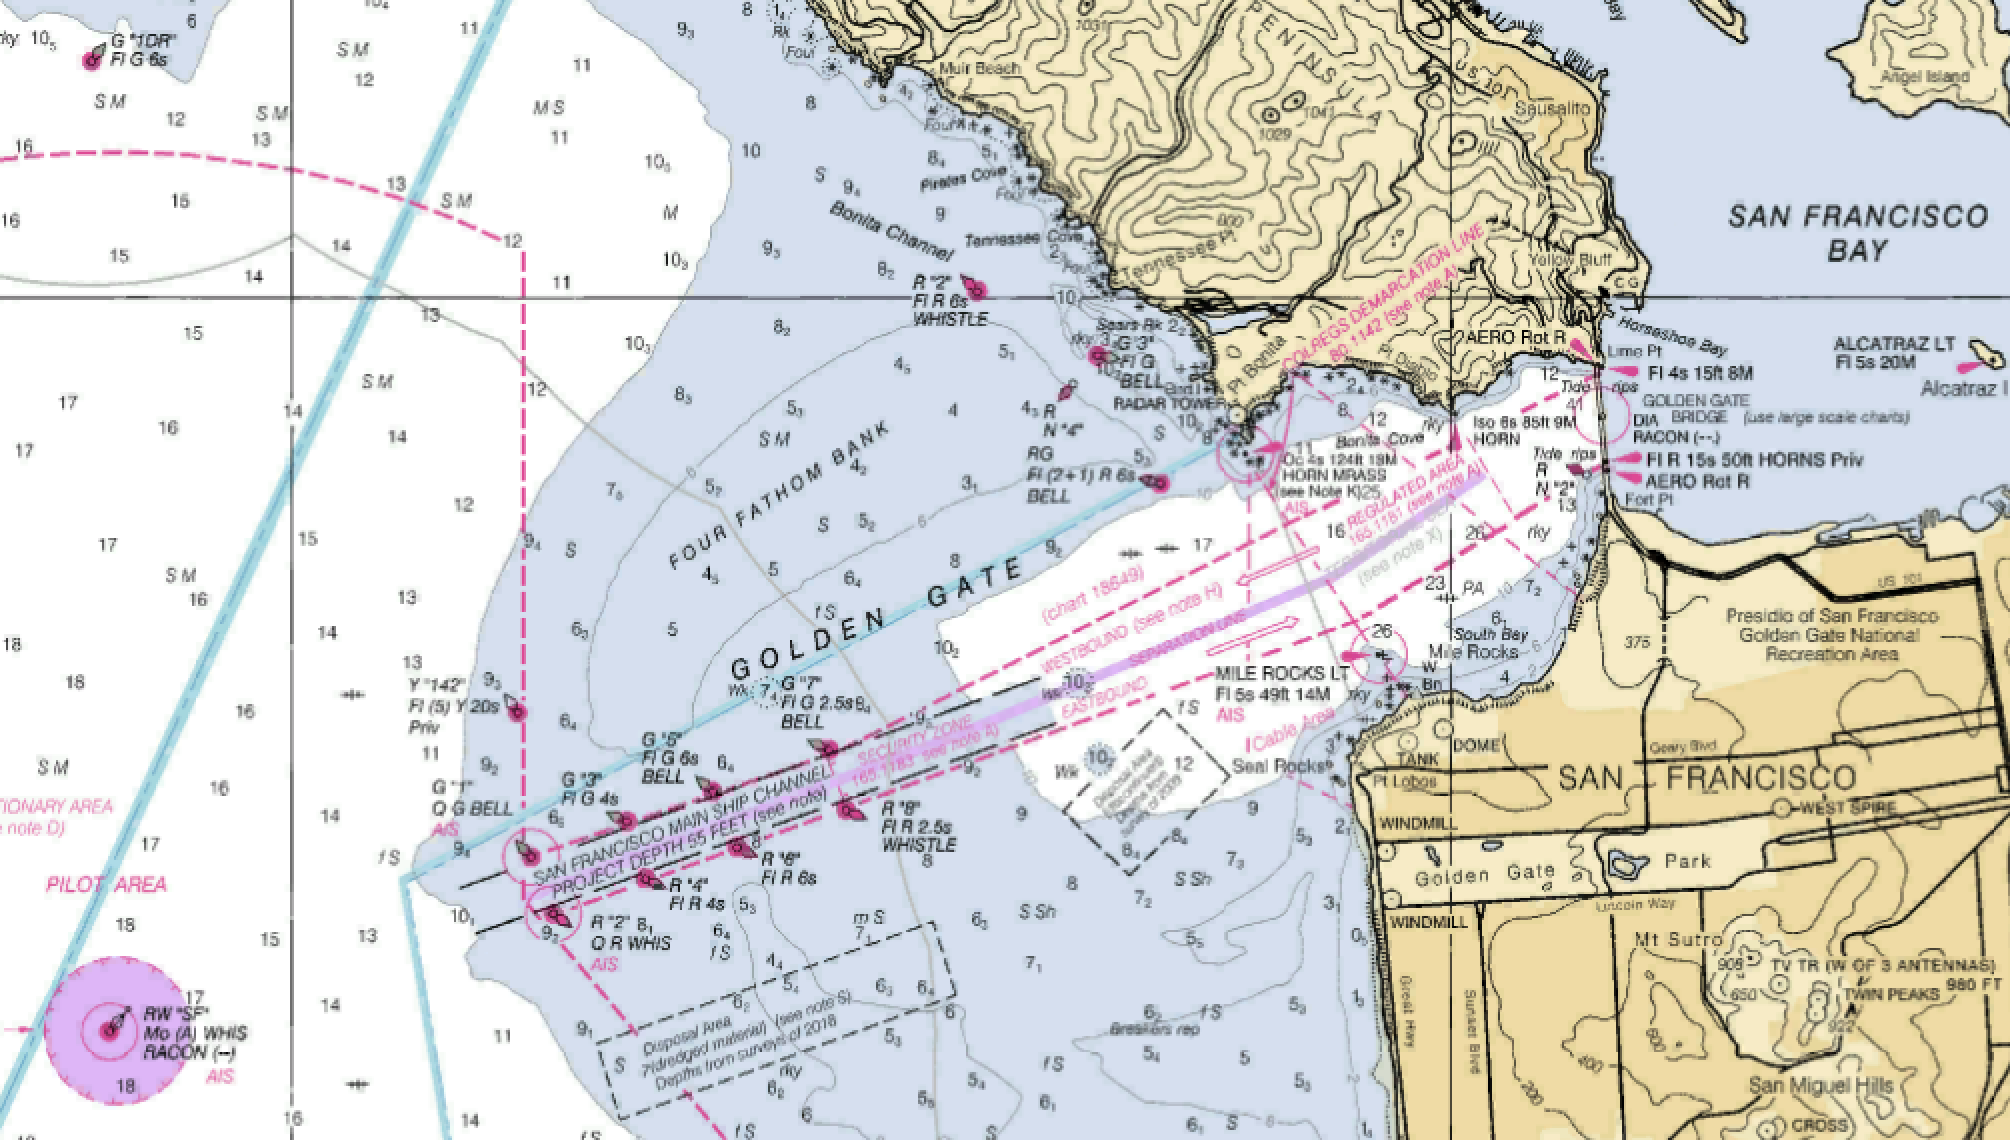
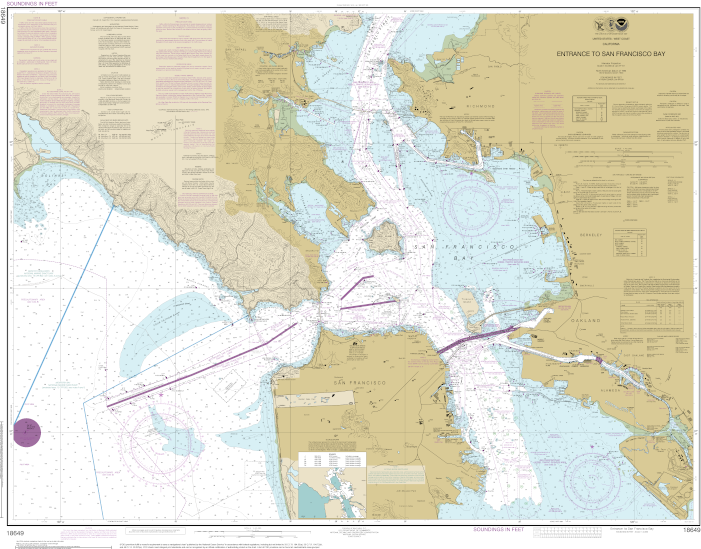
What is Happening In November of 2019, NOAA announced that they would be “Sun setting” traditional production of all raster chart products. In other words, production of traditional NOAA paper charts and all raster products will be completely ceased by January 2025. Since that time, NOAA has been slowly and surely moving toward that goal. For example, support for the Lake Tahoe Chart (18665) ended on August 26, 2021, the Gulf of the Farallones (18645) cancelled October 5, 2022, and the Entrance to San Francisco Bay (18649) cancelled on July 31, 2024. Raster vs Vector (ENC) charts I am probably not the best person to discuss the difference between raster…
-
Create a Universal Plotting Sheet
There may be times when a navigation chart showing contours along the coast and/or navigational hazards is not needed. This is generally the case with celestial navigation, however, you may also find times while piloting along a coast that this is the case. An example might be that you prefer to keep your DR and Fix plotting off of the navigation chart in order to keep it more readable. Using a Universal Plotting Sheet allows you this flexibility. Universal Plotting Sheets may be purchased in pads of 50, or they may be downloaded from the internet. Generally, they will include a compass rose in the center, three pre-drawn latitude lines,…
-
Pilot Charts
What Are Pilot Charts? Pilot Charts provide the navigator with averages. Averages concerning prevailing winds and currents, air and sea temperatures, wave heights, ice, visibility, barometric pressure, and weather conditions. There are five volumes of Pilot Charts, each being its own publication, and each covering a specific geographic region. Each publication is actually a compilation of twelve individual pilot charts, one for each month of the year. Pilot charts are intended to aid the navigator in selecting the fastest and safest routes with regards to the expected weather and ocean conditions. Pilot Charts are not intended to be used for navigation, however, they are invaluable in planning stages of a…
-
Navigation Triangles
Plotting Tool Options There is a wide array of tool options to assist you in navigation plotting. All have pluses to recommend them as your “go to” tool. Unfortunately, all also have cons that make them less desirable or more challenging to use. This tip is specifically how to use navigation protractor triangles (just call them triangles). For a discussion of the plusses and minuses of the other options, check out the lesson on “Navigation Tools – Plotting Tools“ Using Navigation Triangles Why Triangles (aka: What is a Protractor) Before we talk about why I prefer using triangles over the other plotting tool options available to me, let’s talk about…
-
Rose’s Intro to Navigation
Finding Latitude and Longitude Lines of latitude run east and west (across the chart). Lines of longitude run north and south (up and down). Degrees of Latitude Zero degrees of latitude is known as the equator. Latitude goes from zero degrees to 90 degrees north and south of the equator. As can be seen in the image above, Lines of latitude run parallel to each other. There are 60 nautical miles between each degree of latitude. Lines of latitude are a consistent distance apart, so they can be used to measure distance. One degree of latitude can be divided into 60 “minutes”. Each minute of latitude is one nautical mile.…
-
Calculating Wind Speed and Direction
Calculating Wind from Isobars by Table Lookup There are at least two formulas I know of to estimate wind speed based on spacing of isobars on a surface analysis. Both are based on the relationship between pressure gradient (e.g. millibars per degree) and the latitude of interest. For those that are interested, a discussion of each follows. Fortunately, it is much easier to use a table where someone else has done the math for you. Calculating Wind Speed Measurement of the spacing of isobars can be done manually, or with the assistance of a tool. Here, a Surface Analysis of the Northeastern Pacific was loaded and displayed using OpenCPN, a…
-
Pressure Systems
What is Wind The title of this topic might have been “What causes the wind.” Quite simply, wind is moving air. Air doesn’t seem like much, however, it has weight and it has substance, and is actually considered a fluid. This becomes apparent when air moves. While moving, you can see many of the same characteristics you might find in a river. Things like moving as a “unit,” parting and coming back together as it flows around an obstacle, and eddies or back-flows. Air moves from an area of higher pressure into an area of lower pressure. The closer together the high and low pressure is and the greater the…
-
Global Circulation
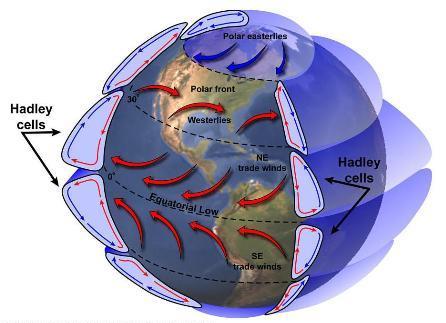
An Island in the sun Back to our island in the sun image. Although not apparent in the image, the rays of the sun do not directly heat the atmosphere. Instead, the sun’s rays heat the land, which in turn heats the air. It’s clear from this small-scale model the sun is the driving force behind the movement of air in this case. But, how about on a larger, global scale. Is the sun still the motivating factor? Yes! Hadley Cells The more directly the rays of the sun impact the Earth, the more energy is transferred, heating the Earth and the atmosphere above it. The sun is located more…
-
Pillar Point to Drakes Bay
You just finished a wonderful dinner and are back on the boat. It’s Thursday evening, and decision time. Do you return home or head up to Drakes Bay for a day or two. Time isn’t an issue. You don’t have to be back until Sunday, or even later if you want. Weather forecast for the next three days. What is your decision? Motor Back Home Motor Directly to Drakes Bay Sail to Drakes Bay Via the Farallon Islands? So, you chose Sail to Drakes Bay via the Farallon Islands Personally, I think you made the best choice. Leaving Pillar Point Harbor, you head to PP, the Pillar Point Approach Buoy…
-
Marine Weather Intro
Knowledge of the weather is as crucial to today’s sailor as it was two hundred years ago. Fortunately, advances in technology have put weather forecasting capabilities within the grasp of the average sailor, who with the click of just a few buttons can bring up surface analysis maps which draw on the talents of some of the world’s most knowledgeable meteorologists. With analysis in hand, and a relatively small degree of knowledge, every sailor is better prepared to face conditions at sea. I am not a trained meteorologist. I’m simply a sailor who found a need to learn a little about the weather. A first glance at a surface analysis…