Aids to navigation can pretty much be summed up as any object that might be used to aid in the process of safe navigation. Here, we will just be talking about some of the major aids found in the US Coast Guard U.S. AIDS TO NAVIGATION SYSTEM card.
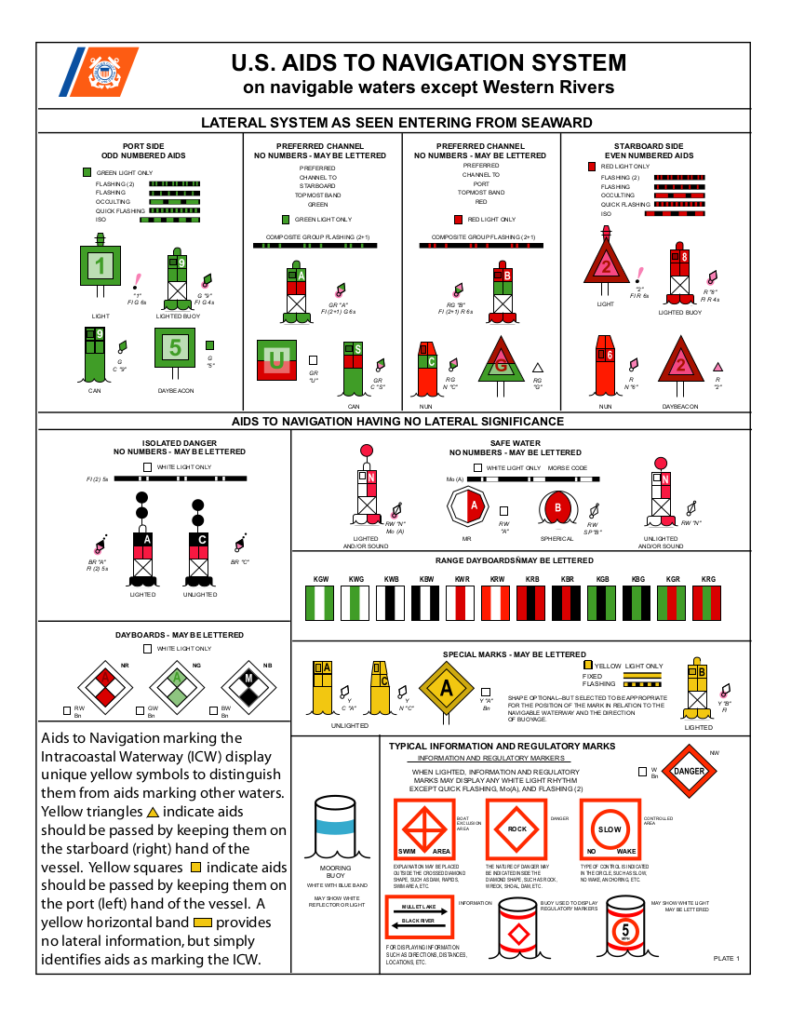
First page of the U.S. AIDS TO NAVIGATION SYSTEM showing the primary ATONs used in the United States.
ATONs in the United States
The U.S. follows a pattern of ATONs known as “Red-Right-Returning.”
Lateral Aids
Lateral Aids indicate the sides. Most often, the sides of a channel. They generally fall into one of four “types”.
Red Marks – right side as seen entering from the ocean (returning.)
Green Marks – left side as seen entering from the ocean.
Red over Green Marks – “Red” Preferred Channel (more below).
Green over Red Marks – “Green Preferred Channel (more below).
mark,n. 1. An artificial or natural object of easily recognizable shape or color, or both, situated in such a position that it may be identified on a chart. A fixed artificial navigation mark is often called a BEACON. This may be lighted or unlighted.
Preferred Channel Marks
In some cases, multiple channels or routes may be available with one considered to be better than the other. The preferred channel is indicated using a preferred channel mark. These are either Red over Green, or Green over Red, with the top color being considered the color of the mark.
To remember what to do with a preferred channel mark, just look at the top color. If it is red, leave it to the right if you are returning. if green, leave it to the left while returning.
Non Lateral Aids
As the name implies, these marks do not indicate the sides.
Safe Water
Advises of “safe water” all around. A common location is at the entrance to a port, placed in a location to line vessel traffic up with the entrance.
These are often mistakenly referred to as “mid-channel” marks because they may be found marking the approximate middle of a wide channel.
Safe water marks flash Morse Code letter A – Mo(A) – {dot dash}.
Isolated Danger
A navigation aid marking a danger (e.g. a rock) with clear water all around; it has a double ball topmark and is black with at least one red band. If lighted its characteristic is Fl(2).
Intra-coastal Waterway
Aids to Navigation marking the Intracoastal Waterway (ICW) display unique yellow symbols to distinguish them from aids marking other waters.
Yellow triangles indicate aids should be passed by keeping them on the starboard (right) hand of the vessel.
Yellow squares indicate aids should be passed by keeping them on the port (left) hand of the vessel.
A yellow horizontal band provides no lateral information, but simply identifies aids as marking the ICW.
Information and Regulatory Marks
International orange geometric patterns on a white background. May be used to advise and/or control. Think along the lines of Stop Signs, Yield Signs, and Merging Traffic signs on a street or highway.
Common ATON terminology
beacon – A fixed artificial navigation mark. Daybeacon, Daymark, Lighted Beacon, and Radio Beacon are all considered types of beacons.
daybeacon – An unlighted beacon. A daybeacon is identified by its color and the color, shape and number of its “daymark.” The simplest form of daybeacon consists of a single pile with a daymark affixed at or near its top.
daymark – The daytime identifying characteristics of an aid to navigation.
buoy – A floating device moored or anchored to the bottom as an aid to navigation.
can buoy – An unlighted buoy of which the upper part of the body (above the waterline), or the larger part of the superstructure has the shape of a cylinder or nearly so.
nun buoy – An unlighted buoy of which the upper part of the body (above the waterline), or the larger part of the superstructure, has a cone shape with vertex upwards.
lighted beacon – A beacon exhibiting a light.
lighted buoy – A buoy exhibiting a light.
Common Light Characteristics
Flashing – (Fl) light period is shorter than the dark phase.
Isophase – (Iso) periods of light and dark are equal.
Occulting – (Oc) period of light is longer than the dark phase.
Group – (Fl3, Fl 1+2), Oc 2+3, etc.) periods of light or of dark are grouped into patterns.
ALA Maritime Buoyage System
A uniform system of maritime buoyage which is now implemented by most maritime nations.
Within the single system there are two regions, designated as Region A and Region B, where lateral marks differ only in the colors of port and starboard hand marks.
In Region A, red is to port on entering.
in Region B (used in the United States), red is to starboard on entering.
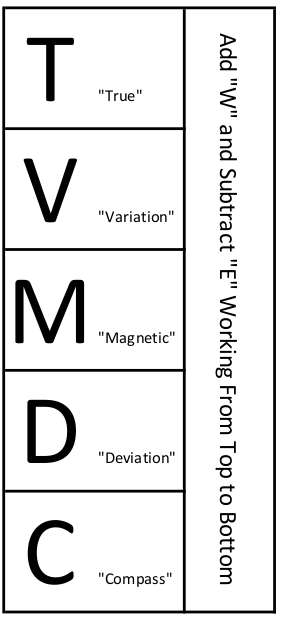
Direction on the Earth can be described using relationships to the North and South Poles. Known as true north, bearings based on true north are unchanging. In the modern world of GPS, equipment can be set to calculate and display true north without additional work on the part of the navigator.
Unfortunately, this isn’t true when using a compass. As we will be exploring in more detail below, a compass reads “magnetic north,” a direction based on the location of the magnetic north pole in relationship to the compass location on the earth.
True vs. Magnetic North
Any discussion of compasses must include a dialogue about true and magnetic north. As you are all aware, the Earth rotates on an axis. The top of the axis is called the North Pole, the bottom the South Pole. A line drawn on the surface of the earth between the geographic North Pole and the geographic South Pole runs exactly North and South and is referred to as a line of Longitude.
Variation
The magnetic North Pole is not at the same point as the geographic North Pole, which means a compass needle pointing at magnetic north will not be perfectly aligned with true north. The difference between true and magnetic north is referred to as “variation” and is expressed as degrees East or West of true north.
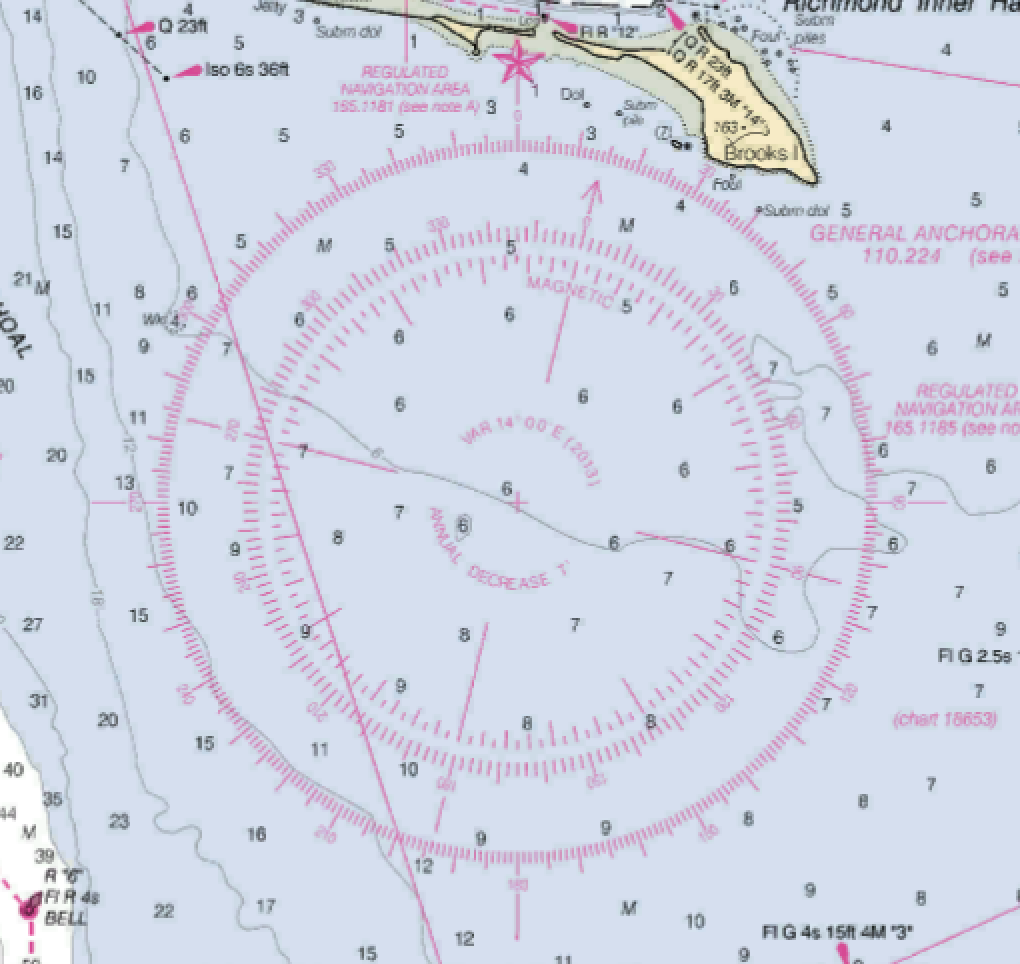
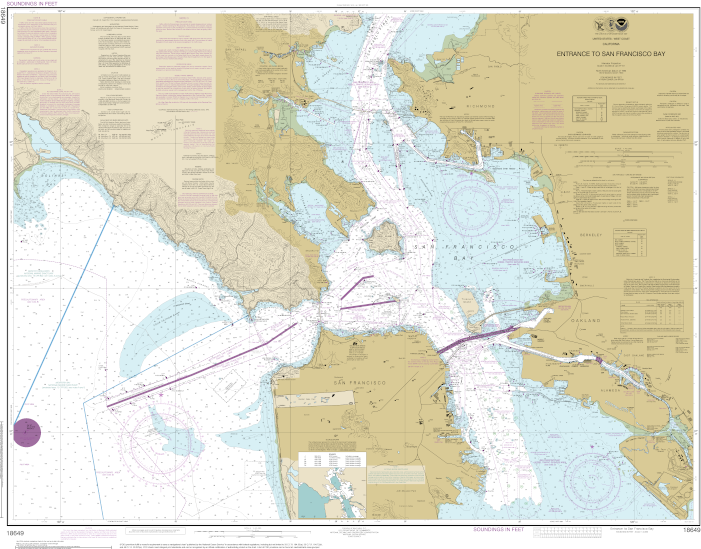
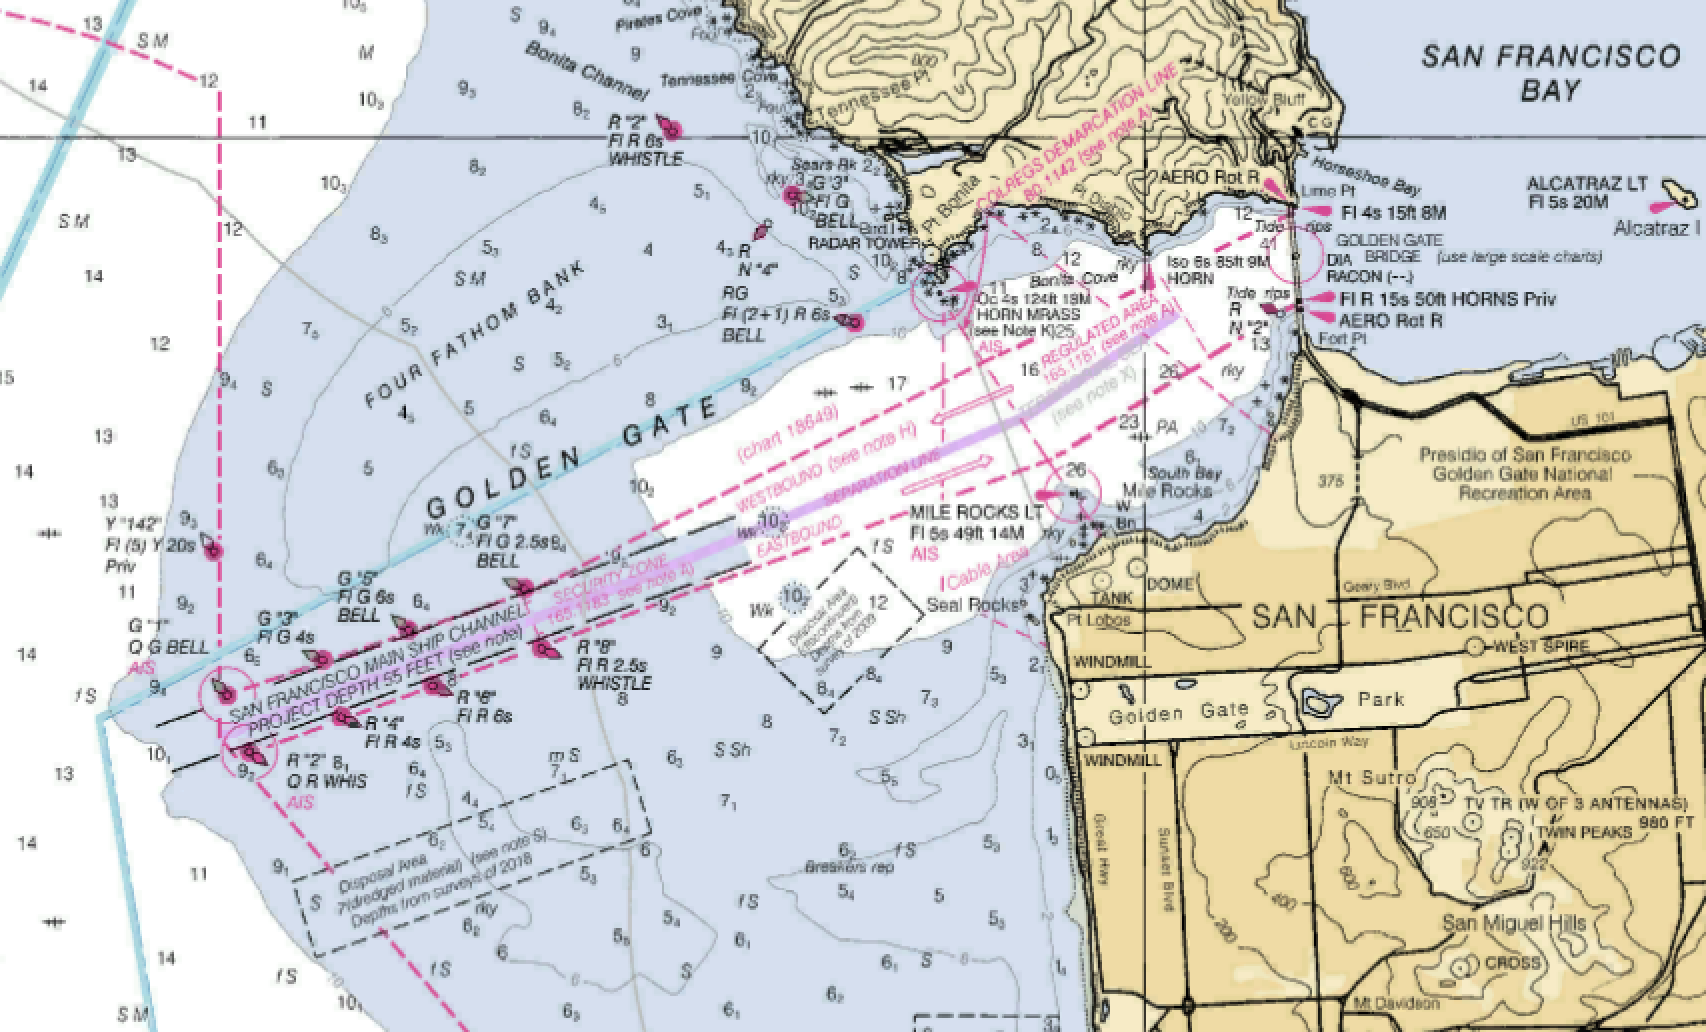
Shown below is an example of a “compass rose” printed as part of chart no. 18649 (Entrance to San Francisco Bay). The compass rose has two superimposed compass circles, the outer circle aligned with true north, and the inner circle aligned with magnetic north.
Compass Rose – Entrance to San Francisco Bay.
The center of the rose indicated variation (VAR). In this case, as of 2013 (the latest NOAA published chart) VAR is 14°00’ to the East of true north. Also included here is an annual change in variation, decreasing by 7’ (minutes) each year.
At the time of this writing, seven years after publication, variation would have decreased by some 49 minutes. There are 60 minutes to a degree, which in theory would make variation approximately 13°11’E in 2020. However, the amount of change is not constant from year to year, making this calculation less than exact. In fact, as of February of 2021, variation at this location is 13°19’E, approximately 8 minutes different than the calculated value.
The net result? If using the chart listed variation, don’t worry too much about adjusting it. Just use 14°E. If you have actual knowledge of what what the updated value is, then use it, rounded to the nearest whole degree. In this case, 13°E
For simplicity sake, always round to the nearest whole degree of variation.
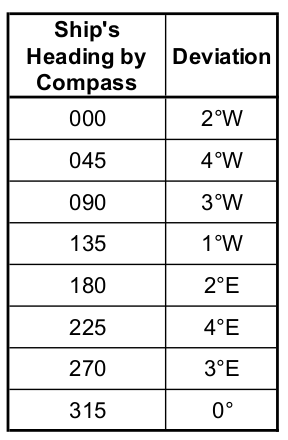
Per Ship’s Compass
Another correction is needed when you realize no magnetic compass is entirely accurate. A compass is impacted by the environment in which it is used. A magnetic compass is mounted amongst a collection of electrical equipment and iron objects. All of which have an effect on accuracy. If you doubt this effect, watch what happens to a compass when you hold a handheld VHF radio near it. The compass needle deflects in an attempt to turn towards the magnetic influence of the radio.
Another version of a deviation card. In this case, data points are plotted and connected with a continuous line. Deviation always graphs as a sine wave, allowing interpolation between plotted data points.
Deviation determined at 045 degree increments as shown is the minimum to use. Better is deviation provided for every 10 or 15 degrees.
Deviation
During compass installation the compass is adjusted to remove as much error as possible. However, error can not be entirely corrected. what is left is know as “deviation” and is slightly different at any direction the vessel might be headed.
How it Works
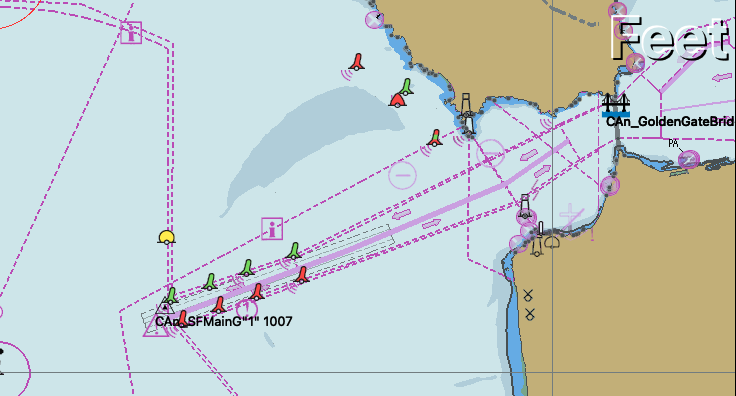
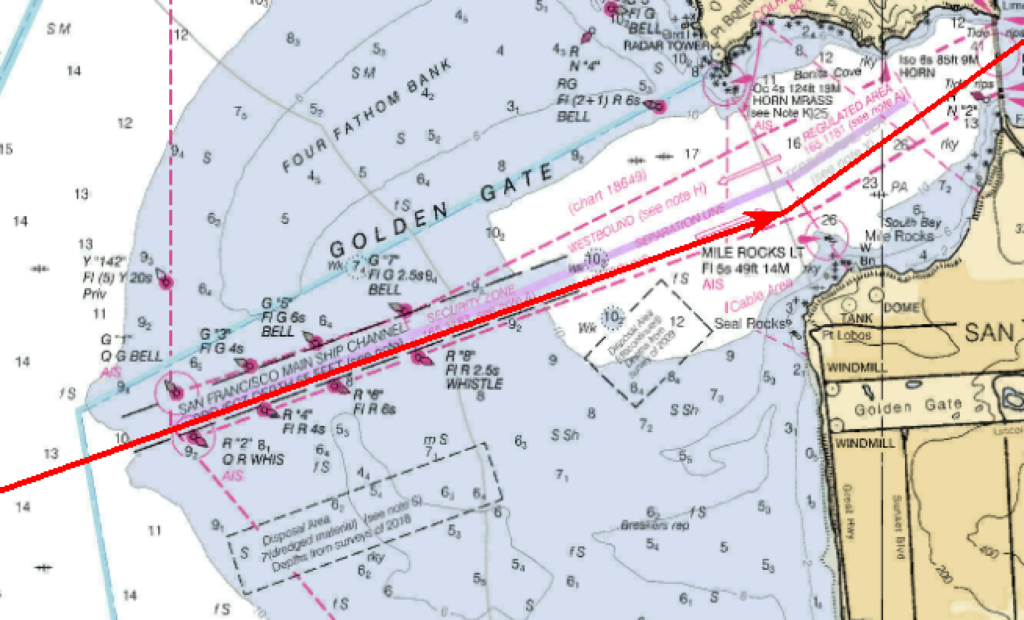
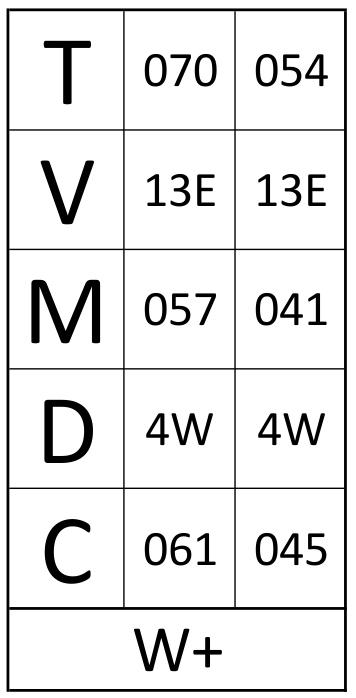
In the example above, a course plotted from the San Francisco approach buoy through the San Francisco Main Ship Channel and under the Golden Gate Bridge requires a course of 070T until the Point Bonita Lighthouse is abeam on the port side, then a course change to 054T passing under the bridge.
Subtracting the San Francisco area variation of 13E, the magnetic courses would be 057M and 041M
The deviation card above indicates a bit less than 4W for each of those magnetic courses. Rounding to the nearest whole degree of deviation results in adding 4W to each. Course to steer would be 061 PSC and 045 PSC.
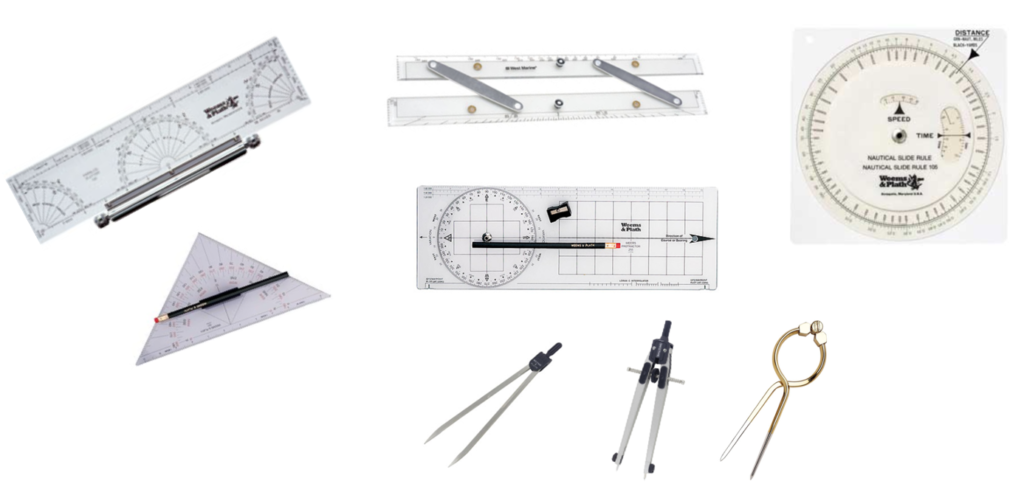
There are a number of plotting tools available to assist in piloting. Every navigator develops his or her own favorites over time, and most find that a very few are used on a regular basis.
In its simplest form, you will need something to measure distance and something to draw straight, parallel lines.
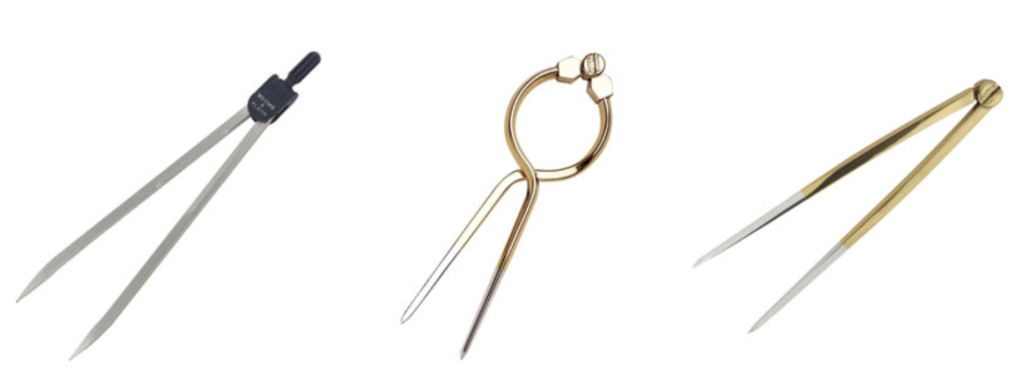
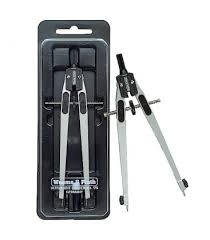
Dividers
Two “legs” hinged at the top to allow the legs to be spread apart to a given distance, and then used to transfer that distance to other locations on a chart. Each leg ends with a sharp point. A warning – the hinge on “cheap” dividers will loosen over time. When this happens, they become worse than useless. Dividers need to hold a set position while in use.
Examples of dividers. The example on the left tends to be less expensive, but wears out quickly.
Compass
Used to draw arcs and circles. Put a pencil lead in one leg of a divider and it becomes a compass. Many marine compasses are similar to ones used in drafting, with one notable difference. The screw mechanism used to adjust the arc radius can be bypassed and the legs closed by simply squeezing.
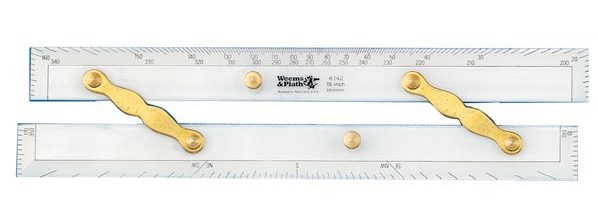
Parallel Rule
Over time, the Parallel Rule has become the standby tool used by many navigators. It is the easiest to learn, however, in my opinion the most difficult to use accurately.
One of the more common tasks a navigator performs is to connect two “dots” on a chart with a line. This is easily accomplished with a ruler. However, that is generally not the end of the task. A parallel line must then be transferred to somewhere else on the chart. For example, up to the compass rose to determine a direction of travel.
Parallel Rule with “Captain William Andrew Field” improved protractor scale.
One of the more common tasks a navigator performs is to connect two “dots” on a chart with a line. This is easily accomplished with a ruler. However, that is generally not the end of the task. A parallel line must then be transferred to somewhere else on the chart. For example, up to the compass rose to determine a direction of travel.
Parallel Rulers are two rulers laying side by side with a hinge setup that allows them rulers to be separated and “walked” across the chart.
If you go with the Parallel Rule as your plotting tool of choice, do not buy the economy model. Instead, get the standard or deluxe model with the protractor scale engraved into the edges. The extra $10.00 you spend is well worth the ease of using the protractor scale instead of trying to “walk” the rule over to a compass rose on a moving navigation table while underway.
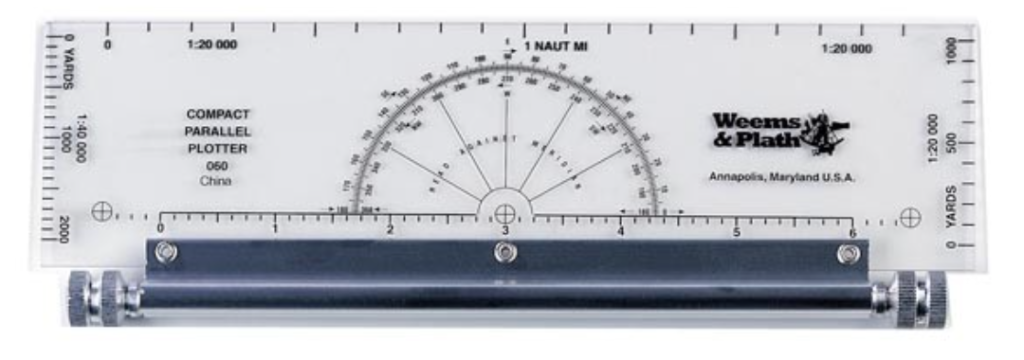
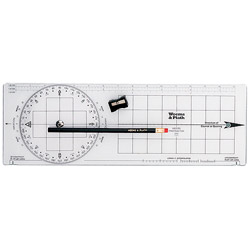
Rolling Plotter
The roller plotter is a great tool for transferring a parallel line to another location on the chart. It moved “up and down” simply by rolling it. To move side to side requires an additional straight edge such as a ruler, parallel ruler, or triangle.
There is a bit more of a learning curve to use a rolling plotter well, however, it is more accurate than parallel rules. There is however a tendency to slip while rolling across the chart.
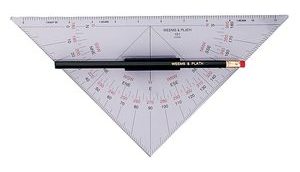
Plotting Triangles
Every navigator has their personal favorites. These are mine. They are the most challenging to learn to use well, however, once mastered they are the most accurate, and least likely to slip of the three tools discussed here.
Two triangles in the hands of an experienced navigator are quick, easy to use, and accurate.
Every navigator has their personal favorites. These are mine. They are the most challenging to learn to use well, however, once mastered they are the most accurate, and least likely to slip of the three tools discussed here.
Two triangles are required with one held in place while the other is slide along its side. Doing this, the triangles can be moved quickly and accurately anywhere on the chart.
Miscellaneous Plotting Tools
There are a number of miscellaneous plotting tools designed to draw and transfer lines. The three discussed above are the most common, however many variations exist. When you have any opportunity to try out something new, do it. You may find a different tool you like better.
Any discussion of navigation publications should begin with what has to be considered the very foundation of navigation, the chart.
An Introduction to Charts
Nautical charts are essential for planning and safe navigation while underway. In the United States, nautical charts are the responsibility of NOAA’s Office of Coast Survey.
A nautical chart details information regarding water depths, bottom contours and characteristics, shoreline contours, hazards and dangers to navigation, positions and characteristics of aids to navigation, anchorages, as well as a wealth of additional information.
Charts may be obtained in either printed (referred to as vector) or electronic versions.
Electronic Navigation Charts (ENCs) may be downloaded free of charge directly from NOAA (or the United States Coast Guard).
Over a five year period, ending December 31, 2024, NOAA gradually discontinued production, maintenance, and updating of vector charts. As of January 2025, many of these “old” charts are still available through print on demand vendors, however, they may not be updated, and there is no way of telling how much longer they will be available. Fortunately, NOAA has created a custom chart tool (where members of the public can create custom paper (PDF) charts or any US waters. https://devgis.charttools.noaa.gov/pod/ .
A comprehensive discussion of the use of paper, electronic charts, and devgis.charttools follows in separate lessons.
Publications
A more complete description of Chart No. 1 and its use is explored in a later lesson.
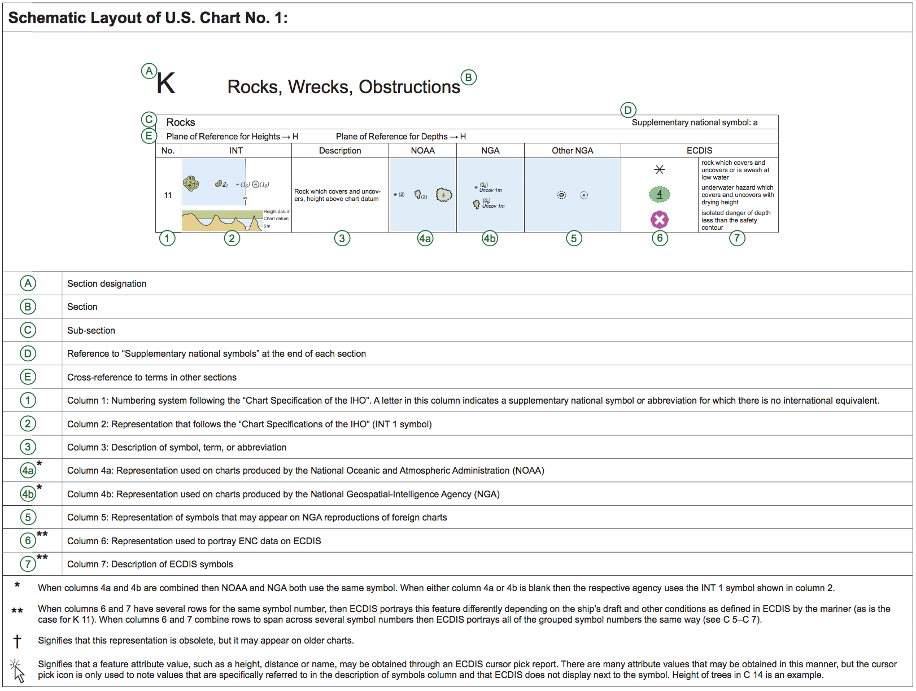
U.S. Chart No. 1
Charts, whether paper or electronic, may seem overwhelming at first glance.
There are an unbelievable number of symbols used to identify features and items of interest to a navigator. A picture of every symbol used along with a brief description of its meaning is found in U.S. Chart No. 1.
As an example, here is a representation of a single item (a Rock which covers and uncovers, height above chart datum) including descriptions of what each section refers to.
Coast Pilot
The United States Coast Pilot consists of 10 volumes covering a wide variety of information important to navigation of U.S. water. Typically, this is information that is not able to be shown in graphic form on a chart.
Information contained in each Coast Pilot includes area specific navigation regulations, visual landmark clues, channel and anchorage data, weather, currents, and navigational hazards.
Planning and approach to an unknown harbor should never be attempted without a thorough review of the appropriate Coast Pilot.
National Geospatial Agency
The National Geospatial-Intelligence Agency (known by the acronym NGA) is the number one source of official publications regarding navigation. A wealth of information for the navigator is found within the webpages of Maritime Safety Information division of the NGA (https://msi.nga.mil/.)
At the time of writing, the NGA publications website may be accessed for viewing or download at “NGA Publications” (https://msi.nga.mil/Publications.)
Available publications include the following. Many NGA publications will be discussed when appropriate in this or later topics.
Also known as Bowditch, The American Practical Navigator was first published in 1802 by Nathaniel Bowditch who referred to it as the “epitome of navigation.” In my opinion, it remains that to this day.
Bowditch has been continuously updated to include advances in navigation theory and technology since its original publication. It is among the foremost guides to navigation and is a must have in any navigator’s library. As of this writing, the most recent update is the 2019 edition.
The 2019 edition of Bowditch is presented in two volumes. Volume I is “the book” itself, while Volume II includes useful tables, calculations, and a marine navigation glossary.
Both volumes, as well as 2002 and 2017 past editions are available for free download in PDF format from NGA publications.
Note: There is a “Wikisource” version of the American Practical Navigator available for viewing in HTML form. However, it is the 2002 edition, and does not include the most up to date information available.
There is a warning on the site that “The source document of this text is not known.” Downloading the PDF directly from the NGA is the better way to go.
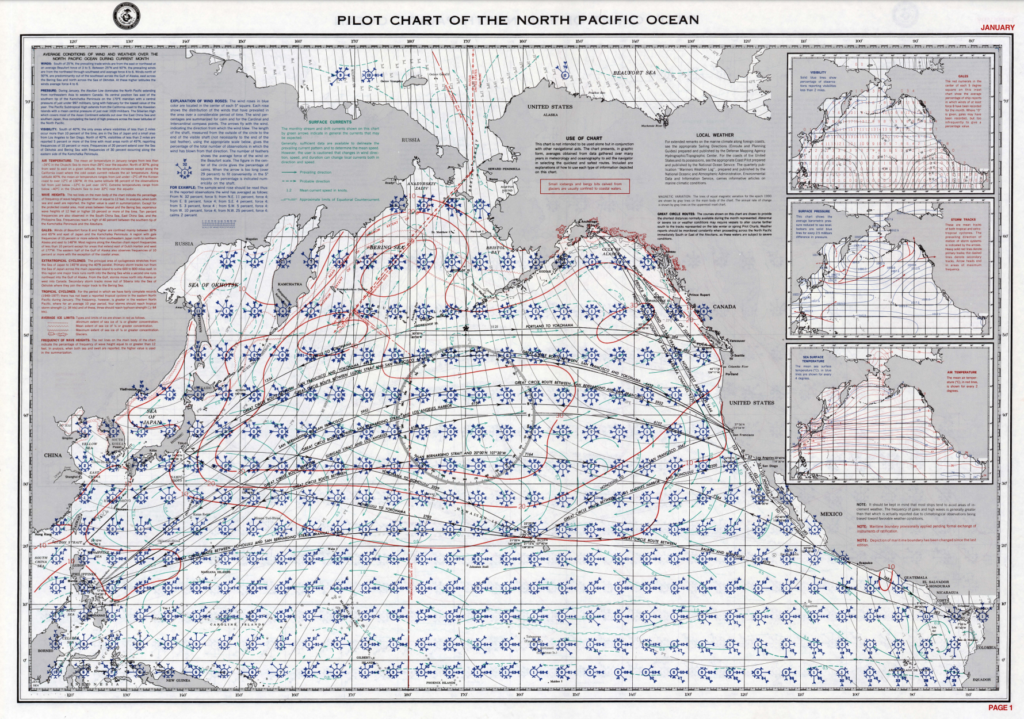
Pilot Charts
Pilot Charts separate the world’s oceans into five regions. Each region has a separate chart for each month of the year.
Pilot Charts include information such as typical wind direction and speed, direction and speed of ocean currents, the percentage chances of waves of 12 feet or greater, storm seasons and past storm tracks.
Sailing Directions Enroute
Containing information similar to the United States Coast Pilot, Sailing Directions Enroute are a series of publications with navigation information on non-U.S. waters.
As with the Coast Pilot, any voyage to a foreign location must include a review of Sailing Directions Enroute for that area.
For convenience of review, they may be downloaded in PDF format. I personally like to print and highlight sections which may impact my route.
Local Notices to Mariners and Notice to Mariners
Often confused, both publications contain valuable informational updates related to navigation safety. The Notice to Mariners is published by the NGA and includes information to update on all U.S. charts and publications. The Local Notices to Mariners are published individually by each of the nine U.S. Coast Guard Districts, and include very detailed and specific information relevant to each specific district.
Valuable information is found in both sets of publications, and both should be used.
Notice to Mariners
The US Notice to Mariners corrects NGA and NOS (National Ocean Service) charts using information collected from many sources, among them the Local Notice to Mariners. The US Notice to Mariners will contain only those chart corrections of interest to ocean-going vessels.
A vessel entering U.S. waters would benefit from downloading the current US Notice to Mariners.
Current and previous, Notice to Mariners may be downloaded as PDF files via https://msi.nga.mil/NTM.
Local Notices to Mariners
The Local Notices to Mariners is the primary means for providing information concerning ATONs (aids to navigation), navigation hazards, and other items of information to mariners on the waters of the United States, its territories, and possessions. These notices are essential to all navigators for the purpose of keeping their charts. Light Lists, Coast Pilots and other nautical publications up-to-date.
Local Notices to Mariners is the best resource for updating charts on specific sailing areas in US Waters.
While navigating outside of U.S. waters, it continues to be important to keep abreast of changes and updates to the maritime environment. Most countries with a maritime tradition have publications similar to Notice to Mariners and/or Local Notices to Mariners. Two examples follow:
NOTMAR – The Canadian Coast Guard Notices to Mariners
Before operating in foreign waters, every effort should be made by a diligent navigator to obtain up to date information about the intended sailing area(s).
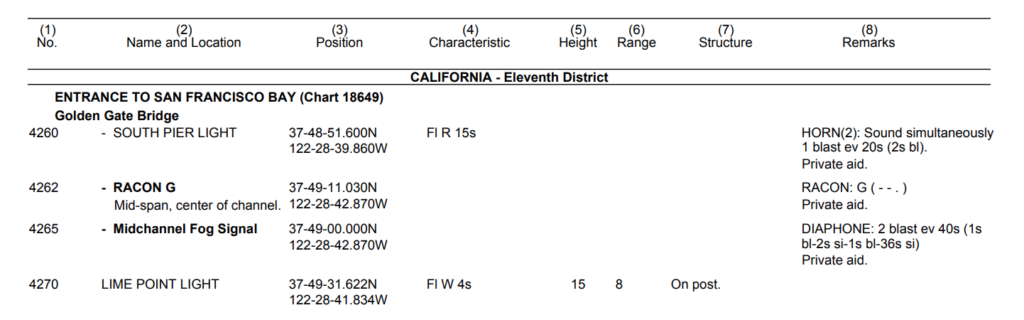
Light List
The name may be a bit deceiving, as the The USCG Light List (Light List) contains information on more than just lights. It is published in seven volumes and contains details about lights and other aids to navigation used for general navigation maintained by or under the authority of the U.S. Coast Guard.
Each volume corresponds to a different regional area and contains more complete information on each aid to navigation than can be conveniently shown on charts.
What I consider to be a valuable bonus to the Light List is the abbreviation lists and glossary pages found at the beginning of each Light List publication. If you are not sure of the difference between a buoy, a beacon, and a daybeacon, this is one place to look. Or, how about the what flashing, occulting, and isophase mean.
TheLight List is updated weekly and may be downloaded in PDF form.
Tide and Current Tables
The effects of moon and sun on the level of the water in our oceans, especially in the coastal areas, is very noticeable. Most coastal areas of the world experience two periods of high water, and two periods of low water each day. the volume of change depends on too many factors to easily discuss here, however, knowing the amount of change in your sailing area is critical to safe navigation! This is where tide and current table come in.
In the United States, the meaning of the phrase tide tables was turned upside down January 1, 2021. On that day, due to the availability of electronic predictions products, NOAA ended production of printed tide table publications. The final printed edition provided tide and tidal current predictions for the calendar year 2020.
Tide and Tidal Current predictions are now available through NOAA online services. While others may disagree, in my opinion, this is a good change, simplifying the process of getting tidal information for a specific area.
Today, the two primary sources of tidal information are:
Both of these online pages my be reached from https://tidesandcurrents.noaa.gov/, which also includes an interactive map designed to help located site specific data.
Note: Private printing companies will still use NOAA data to print tide and current booklets specific to a given area. These “Tide Books” will have very similar appearance and included information as included in past booklets.
Cruising Guides
Cruising guides are private books and publications containing information relevant to specific areas, generally written by someone that has been there.
Some cruising guides are very good. Some, not so much. If you are headed somewhere, do a bit of research on what private cruising guides are available, which are good, and which may have the most current information. Remember, an excellent cruising guide written 20 years ago may not have the up to date information you need to be safe!
Other Publications
As you explore the world of marine navigation, you will find a large number of other publications. Publications like Nautical Almanacs, Sight Reduction Tables, and Radar Navigation Manuals. Indispensable in their place, they are not required for coastal navigation and piloting.
A bearing is the direction to an object or location, expressed as degrees relative to a reference point or direction. In piloting, three “types” of bearings are used most often.
A bearing expressed in degrees true uses true north as the reference point. True north is found by drawing a line between the North Pole and the South Pole, known as a line of Longitude. The direction along this line to the North Pole is “True North” and is labeled as 000° (degrees).
The bearing to the object is determined by calculating the number of degrees clockwise from 000° to the object.
The graphic included above shows the compass rose included in the chart “Entrance to San Francisco Bay”, chart no. 18649. The star at the top indicates true north. Degrees relative to true north are provided along outer most circle of degrees. Inside the true north compass circle is a second circle which has been rotated from true north providing degrees magnetic.
Magnetic Bearing
A compass does not point in the direction of true north. Instead, it points towards the magnetic north pole. In marine navigation, the difference between true north and magnetic north is known as variation.
Note: You may also hear the term declination used to describe the same thing, however, in marine navigation the term declination is used only in celestial navigation.
Variation is not the same in different parts of the world. For example, in San Francisco Bay, variation is 13° 21′ E, meaning the compass points a bit over 13 degrees to the east of true north. In the waters near Martha’s Vineyard, variation is 14° 17′ W, and near Hawaii, it is 9° 30′ E.
To make things a bit more confusing, the magnetic north pole is constantly moving, resulting in magnetic north changing from year to year. For example, in San Francisco Bay, variation decreased from 14° 00′ E to 13° 21′ E between 2013 and 2020. In Martha’s Vineyard variations increases each year, and in Hawaii, it currently remains fairly constant.
The center of the compass rose includes a written description of variation, an “as of” date, and the annual increase or decrease rate [14° 00′ E (2013) Annual Decrease 7′]
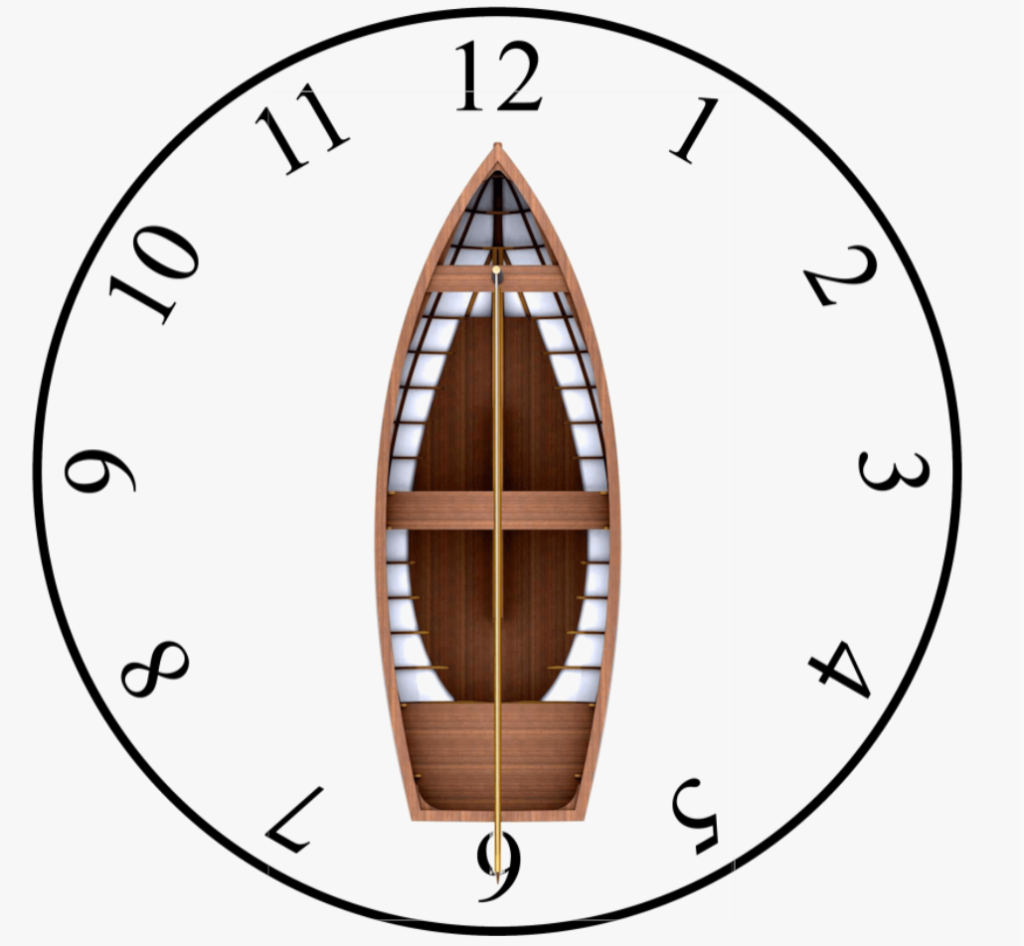
Relative Bearing
As was indicated earlier, all bearings are relative to something, however, the term “relative bearing” is reserved for bearings that are relative to your vessel.
Probably the easiest way to visualize relative bearings is to start by using a clock face. Most of us have spotted another boat or a buoy and used the phrase “at 2 o’clock” to describe its location. What we have actually done is described the target’s bearing relative to the heading of our own vessel.
Unfortunately, the face of a clock is a bit too vague for use in navigation. All other bearings are expressed using the 360 degrees of a circle found on a compass. The relative bearing is no different. Simply substitute the number of degrees for the numbers on the clock face. 1 o’clock becomes 30°, 2 o’clock becomes 60°, 3 o’clock becomes 90°, and so forth around the face of the “compass/clock”.
Now, a target at 2 o’clock becomes 60° relative to our own vessel’s heading and a target at 10 o’clock is 300° relative.
In some usages, it may be more convenient to refer to bearings to the left of your vessel heading as degrees relative to port. In other words, a relative bearing of 300° might also be expressed as 60° to port. This is acceptable, as long as it is clearly labeled as such.
However, for now, I recommend all relative bearings be given to starboard relative to the heading of your vessel. Exceptions will become clear when you need them.
R + S = T
I hope you will always know the direction your ship is heading. If you do, and you know the relative bearing to a target you can always calculate its true bearing. Likewise, with your heading and the target’s true bearing, you can easily calculate its relative bearing.
R+S=T is easy to remember. It is in alphabetical order. It stands for: Relative Bearing + Ship’s Heading = True Bearing.
If you have a relative bearing of 020° and a ship’s heading of 090° then the true bearing to the target is 110° (20 + 90 = 110).
If R+S=T is true, then simple math tells you that T-S=R must also be true. Therefore, a true bearing of 110° minus a ship’s heading of 090° yields a relative bearing of 020°. If you get confused about whether to add or subtract, if you are working the alphabet from A to Z, then add. If you are going backwards, from Z to A, then subtract.
Dead reckoning uses only course, speed, time, and distance to establish an approximate position.
Two or more lines of position are required for a fix of a vessel’s actual location.
An estimated position is anything in between. As a result, it may be a DR position with set and drift taken into account. It may also be a single line of position in plotted into a DR location.
While estimated positions are approximate, they are more accurate than a simple DR position.
Chart Notation
Estimated position is identified by a square with a dot in the middle.
The plotting symbol for an estimated position is a square with a dot in the middle. In the example above there is no indication of the additional factor used to establish the estimated position. Under normal circumstances, set and drift or the single line of position used would be added to the plot as in the following examples.
Set and drift and the estimated position
Expanding on the illustration above, set and drift have been added in this example.
An estimated position based on the DR plus set and drift.
A complete discussion of set and drift, how to calculate it, and how to compensate for it may be found in the Set and Drift lesson.
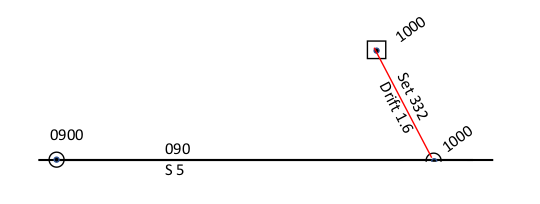
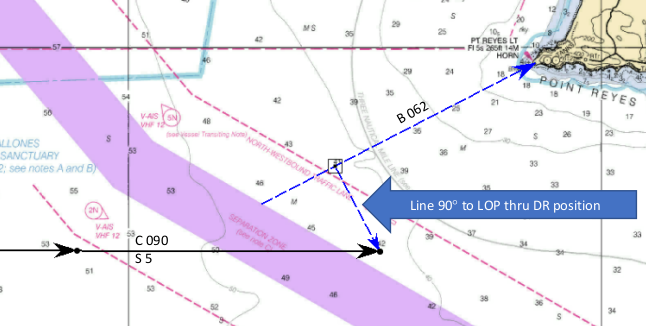
Set and drift and a single line of position
Establish an estimated position (EP) using a bearing to an object as a single line of position (LOP). The closest point along the LOP to the DR position is the EP. A 90° angle from the LOP to the DR position is always the closest point.
Estimated position established using a single LOP and DR plot
Steps to find an Estimated Position using a single LOP
Construct DR Plot
Obtain bearing to an object. Plot to establish a single LOP
Draw line at a 90° angle to the LOP. Line passes through the DR position
Estimated position is the point on the LOP that the 90° line originates from.
Continuing the DR plot
In the Dead Reckoning and Fixes lessons you were instructed to “reset” the DR plot anytime a fix is established. An estimated position is not a fix. It is still considered an approximate position. Consequently, the plot should not be reset. Instead, continue with the existing DR plot.
Recognize factors contributing to DR vessel location “inaccuracy.”
Comprehend what a line of position (LOP) is.
Understand steering error
Define Leeway
Describe Set and Drift.
Explain Course Made Good and Speed Made Good.
Establish an estimated position using DR and a single line of position.
Resolve set and drift by comparing a DR position with a Fix.
Determine course to steer to compensate for known set and drift.
Factors contributing to location inaccuracies
A navigator must always keep a running DR plot. As discussed in the lesson on Dead Reckoning a DR position should be updated and plotted at a minimum of hourly and at any speed or course change.
While every effort is made for accuracy, there are a number of factors that might contribute to inaccuracy of a DR position.
Wind – The leeward motion of a vessel due to wind is known as leeway. A wind blowing from port with case the vessel to move to starboard of the intended track. The angular difference between a vessel’s course and the track due to the effect of wind is known as leeway angle.
Steering Error – Failure to hold the desired course is steering error. The underlying cause of steering error might be deviation changes in the vessel’s steering compass, the impact of sea conditions on keeping a stable course, or inattention on the part of the helms-person.
Current – As a vessel moves through the water, it moves “off course” in the direction of and at the speed of currents in the water. The direction of current flow is known as set. Speed of the current is drift.
Factors contributing to location inaccuracy may cancel each other out. For example leeway from a wind on the port side might be canceled out by current coming from starboard. Unfortunately, they can just as easily be cumulative with wind from port and current from port adding together to push you far right of your intended course.
Set and Drift
Changes in movement of a vessel’s intended course due to current are known as set and drift. Again, set is the direction of movement. This direction is marked on the chart using a 3 digit compass direction the current is moving toward. Always plot set using degrees true. Drift is the speed of movement. Another way to say it is; the distance traveled in nautical miles in one hour. When set and drift are known, an estimated position must be plotted with each DR position.
Estimated Position
A DR plot is based solely on course, speed, time, and distance. When any other factors are introduced, the established position is referred to as an estimated position. More detailed information can be found in the Estimated Position lesson.
In practice, how set and drift are plotted depends on two things. First, are the set and drift unknown, or known before starting out? Second, if known, do you as the navigator want to plot the EP as an integral part of the DR plot, or to add the DR position after the DR location is plotted. Examples of each option are provided below.
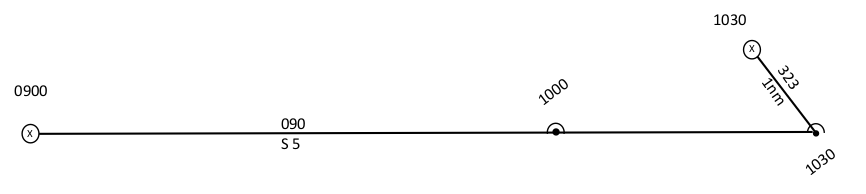
Unknown set and drift
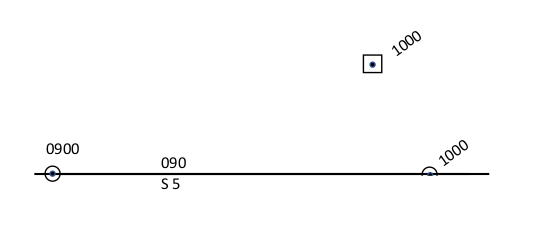
It goes without saying, if set and drift are unknown simply plot a normal DR position. When at some point in the future you establish a position fix, set and drift can be calculated. Assuming your fix is different than the DR position, simply draw a vector from the DR position to the Fix. The direction of the vector is your set. The length represents drift over “total time”. Make sure to convert drift to a one hour time span.
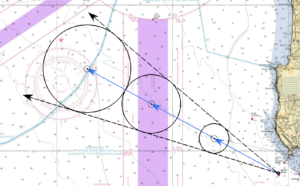
Example calculating unknown set and drift. Vessel traveling 090 at 5 kts. At the end of 1.5 hours, a fix is obtained. A vector (a line representing direction and speed) drawn from the DR position to the fix indicates a set of 323. The vector is 1 nm long. Distance divided by time = speed . 1 nautical mile divided by 1.5 hours (1 / 1.5) = .7 kts drift.
Known set and drift
While generally dead reckoning incorporates only course and speed into the plot, there is one major exception to this rule. When dealing with a known current, the set and drift may be built into the plot. The resulting DR position is in effect an estimated position, however, it typically not labeled separately.
In the illustration below, the scenario is the same as the previous one. The helm is steering a course of 090 at 5 kts. However, in this case the navigator knows there is a set of 323 @ .7 kts. The resulting course made good is 083. The speed over ground is 4.6 kts.
Unfortunately, it can be challenging to do a DR plot this way, especially if there are course and/or speed changes along the way. Essentially, the navigator has to do a separate plot using a plotting sheet to determine course made good and speed made good for each leg of the voyage before plotting the leg. Imagine a sailboat trying to sail to windward, making a tack every 30 minutes. Trying to calculate course made good and speed over ground for each leg would be a challenge at best, and a nightmare at worst. It is much easier to do a normal DR plot, and then apply known set and drift to the ending DR position.
Correcting for set and drift – determining course to steer
Back to our first example. The course made good will be substantially North of desired if set and drift are not compensated. Obviously, steering somewhat South of your desired course will put you on the proper course. The question is how much.
One-hour vector triangle
Use a one-hour vector triangle to calculate course to steer. A one-hour vector triangle may be completed directly on the chart or by using a separate plotting sheet as long as accurate directions and distances can be marked. A Maneuvering Board is used for this example.
Course to steer example
Assume the following
Desired Course 090T
Estimated Vessel Speed 5 knots
Set 323T
Drift .7 knots
Steps – refer to the illustration below
Beginning at the vessel’s starting position (A) draw a vector representing the desired course, extending the line to point B, well past the distance to be travelled in one hour. Line AB represents the desired Track Made Good.
From point A draw a vector the direction and length of the set and drift ending at point C
Using point C as the center, strike an arc the distance traveled in one hour. The point the arc crosses line AB becomes point D
The course to steer is the direction represented by line CD (096)
The estimated Speed Made Good is the length of line AD (4.5 kts)
Dead Reckoning is the systematic determination of present position, based upon course and distance travelled from a known location. It is a way to find an estimated future vessel position. In fact, possibly its most important use is projecting into the near future to see hazards. As a result, avoiding dangers along the way to a destination. In other words, dead reckoning shows the best route to follow to arrive at your destination safely.
Variations on a name
No one is quite sure where the term “dead reckoning” came from. It may be a shortened version of the phrase “deduced reckoning,” which does a great job of describing the process. Sailors of old tended to be a bit lazy with their language usage. Many words and phrases got shortened. As a result, “deduced” may have become “ded.” Of course, that sounds like “dead”, and here we are. Throughout this course we will use the term dead reckoning, or the acronym DR.
Things to consider
Four factors become part of a dead reckoning plot.
Course
Speed
Time
Distance
First, a couple of definitions. Course is the intended direction of movement through the water. Heading is the direction the bow, or head, of the boat is pointed. In reality, heading and course may or may not be the same at any given point in time, however, to start we will treat them the same. Later, we will discuss variations on the idea of course such as course made good and course to steer.
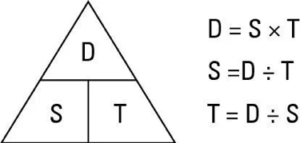
The “D Street” Triangle
Knowing how to calculate missing factors is important. A “tool” called the D Street Triangle is a great memory aid when working with Time, Speed, and Distance calculations. If you know any two you can calculate the third.
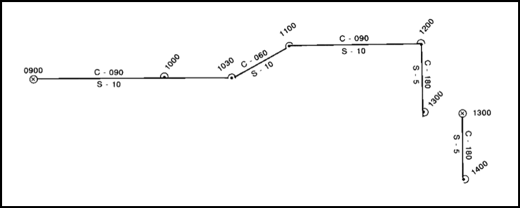
A DR plot requires a known starting point referred to as “taking departure.” This is your last known accurate position and is marked on the chart with an ⊗. The time of departure is noted horizontally on the chart. The size of the circle represents the degree of accuracy of the fix.
Items included in a DR plot
Time of each DR and/or fix position using 4-digit military time with no punctuation (e.g. 0800 or 1500)
Time – written horizontally for fixes, and diagonally for DR positions
Course line (carried out for two estimated future DR positions)
Above the course line, the letter C followed by the 3-digit course in degrees true for the ordered course (e.g. C 060).
Vessel speed in knots (e.g. S 5)
Should I label my course in true or magnetic?Sample DR plot. Mark the course above the line in degrees True. Speed and distance are below the line. Time is written in 24 hour format. Fixes written horizontally. DR positions diagonally. When a fix is obtained at 1300, the plot is “restarted”. DR positions are plotted on the hour, and at course or speed changes.
Update the plot at least
Once an hour, on the hour
At every course (or speed) change
Any time a line of position is established
At every fix the DR plot should be reset, and a new DR plot begun
Fix Expansion
By its very nature, dead reckoning contains errors. The effects of compass error, helmsperson error, wind, and current alter your actual direction of movement through the water so that actual course achieved (course over ground – COG) differs from your intended course or heading.
DR positions are always estimates
Sea state, wind, and currents result in a different speed over ground then speed through the water. Errors may cancel each other out, or they may be cumulative, resulting in greater error. Meaning that a DR position must always considered approximate. However, a navigator must understand all possible hazards along the path of travel. They must be known and accounted for. Fix expansion is an easy method of accounting for additive error while maintaining the assumption of an accurate vessel position.
Errors in course and speed are a function of time
The navigator estimates that at the end of one hour the DR position could be up to 1nm off, so a circle is drawn around the DR position. After 2 hours, 2nm. After 3 hours, 3 nm. At each DR, the vessel should be located somewhere within the appropriate circle.
Consequently, as time passes, the error grows. To offset, the navigator incorporates an estimate of the maximum cumulative error into his plot. The he draws a circle of the appropriate size around his DR position. The area covered by each circle represents every possible position of the boat.
Understanding and practicing good navigation techniques and procedures is critical to safe travel in a boat.
The goal of Navigation in a Modern World is to provide basic piloting and coastal navigation practice in a way that is understandable and easily used by the average person.
We will be exploring traditional navigation processes. Which means paper and pencil. However, we will also look at modern methods utilizing GPS and online resources.
Each link below takes you to a different navigation topic. Because proper tools are critical to all marine navigation, and is therefore a logical place to start, the first link is Navigation Tools.
Although many professional navigators may disagree, traditional navigation does not label courses using degrees magnetic.
Courses may be written in the navigation log in degrees using the ships magnetic compass (aka per ship’s compass – PSC). However, all courses included on a chart should be converted by the navigator and expressed in degrees true.
Why?
Consistency. If you always use degrees true, you will never confuse true and magnetic.
Plotting using True bearings allows the use of navigation tools such as Navigation Triangles, Douglas Protractors, and Douglas scales on parallel rulers, all of which simplify plotting.
Variation changes with location and over time.
Deviation may change with equipment changes on the vessel.
True North does not change.
At the navigators discretion, bearings to an object and danger bearings (two topics to be covered in a later lesson) may be labeled using true or magnetic. If labeled in magnetic, an “M” must be used after the three digit direction (e.g. 045M).