Category: Uncategorized
-

Create a Universal Plotting Sheet
There may be times when a navigation chart showing contours along the coast and/or navigational hazards is not needed. This is generally the case with celestial navigation, however, you may also find times while piloting along a coast that this is the case. An example might be that you prefer to keep your DR and Fix plotting off of the navigation chart in order to keep it more readable. Using a Universal Plotting Sheet allows you this flexibility.
Universal Plotting Sheets may be purchased in pads of 50, or they may be downloaded from the internet. Generally, they will include a compass rose in the center, three pre-drawn latitude lines, and one centrally located line of longitude. They are printed with “minute” marks (miles) for latitude and a scale to use in determining minutes of longitude. Having a pad on board is always a good idea.
Unfortunately, having a pad on board is not always the case, and “using the up” during practice can be expensive and frustrating. Fortunately, there is another solution. You can use any conveniently sized paper (e.g. 8.5 x 11) to make your own. I personally like to just use a blank notebook as a navigation log, and use a blank page in it to create universal charts as needed. Here is how.
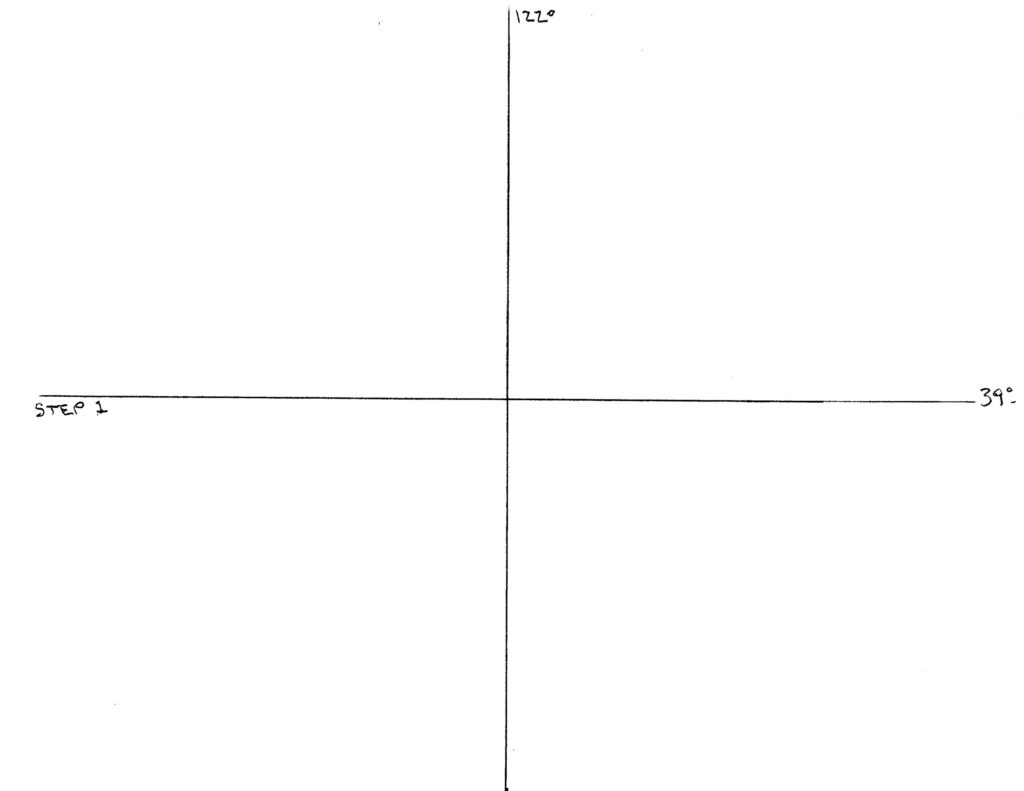
Plot The Primary Latitude and Longitude Lines
Step one: Using a convenient size of paper (in this case, 8.5 x 11), draw a horizontal line and a vertical line at approximately the center of the page. Label the horizontal line with the desired latitude and the vertical line with the desired longitude. In the example, Latitude 39N and Longitude 122 W were selected.
Draw an Angle Representing Your Latitude
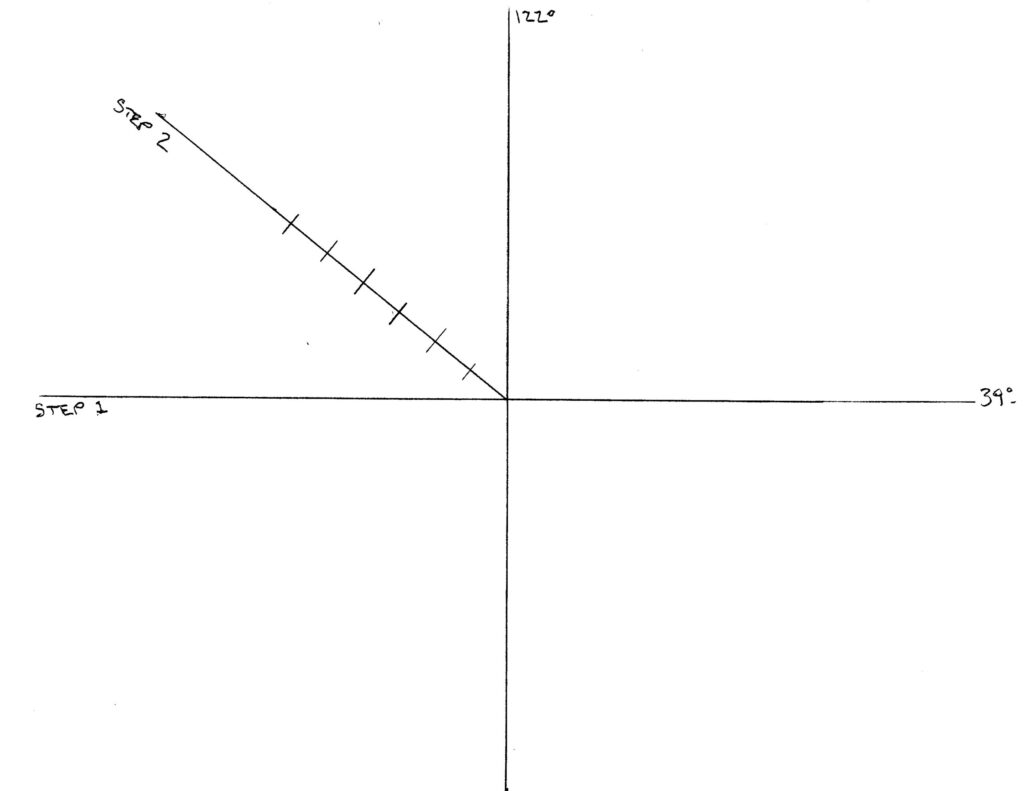
Step two: Draw an oblique (diagonal) line representing the angle equal to the center longitude line. Here, the line is drawn at a 39 degree angle from the horizontal line.
Mark the oblique line in increments equal to the scale you have decided to use. I chose to use a scale of 1/2 inch for every 10 miles. Six equally spaced divisions every 1/2 inch is equal to 60 miles, or 1 degree of Latitude.
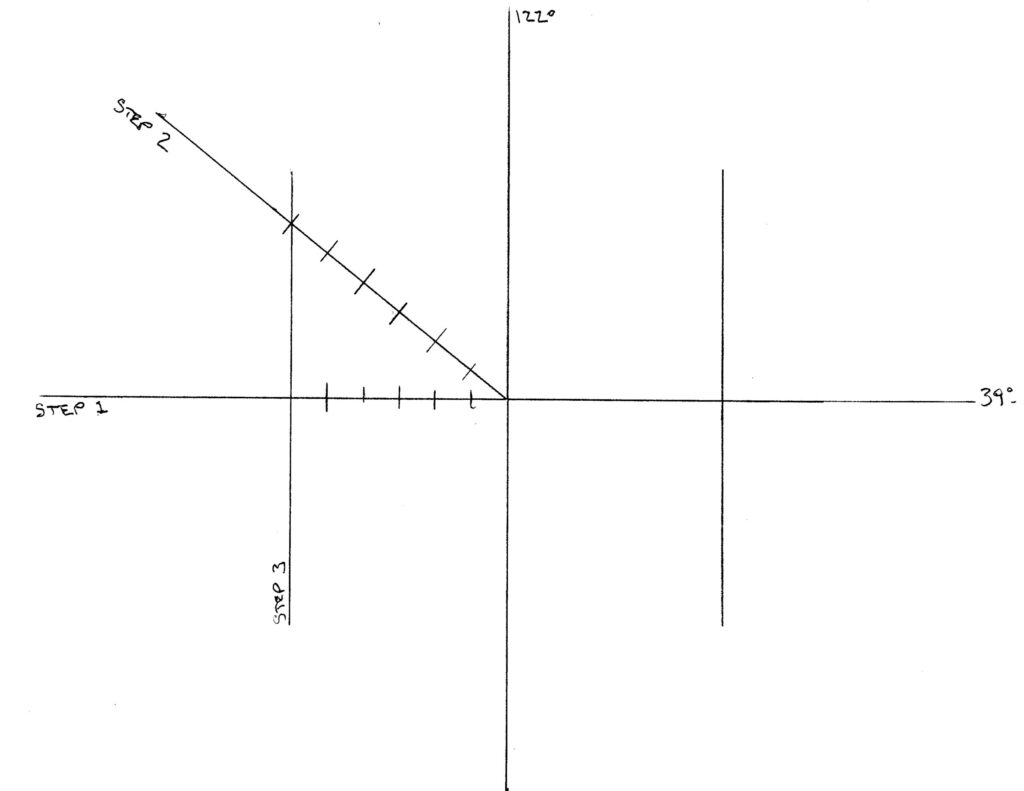
Find Your Longitude Lines and Minute Gradations
Step three: Drop a vertical line from the sixth diagonal division mark to the center latitude line. This line marks the location of the next degree of longitude. Draw another vertical line an equal distance away from the center longitude line on the opposite side. Your universal plotting sheet now includes 2 degrees of longitude. A final part of this step is to drop a mark straight down from each diagonal division down to the center latitude line. Each mark on the latitude line is equal to 10 minutes of longitude and each mark on the oblique line is equal to 10 minutes (miles) of latitude.
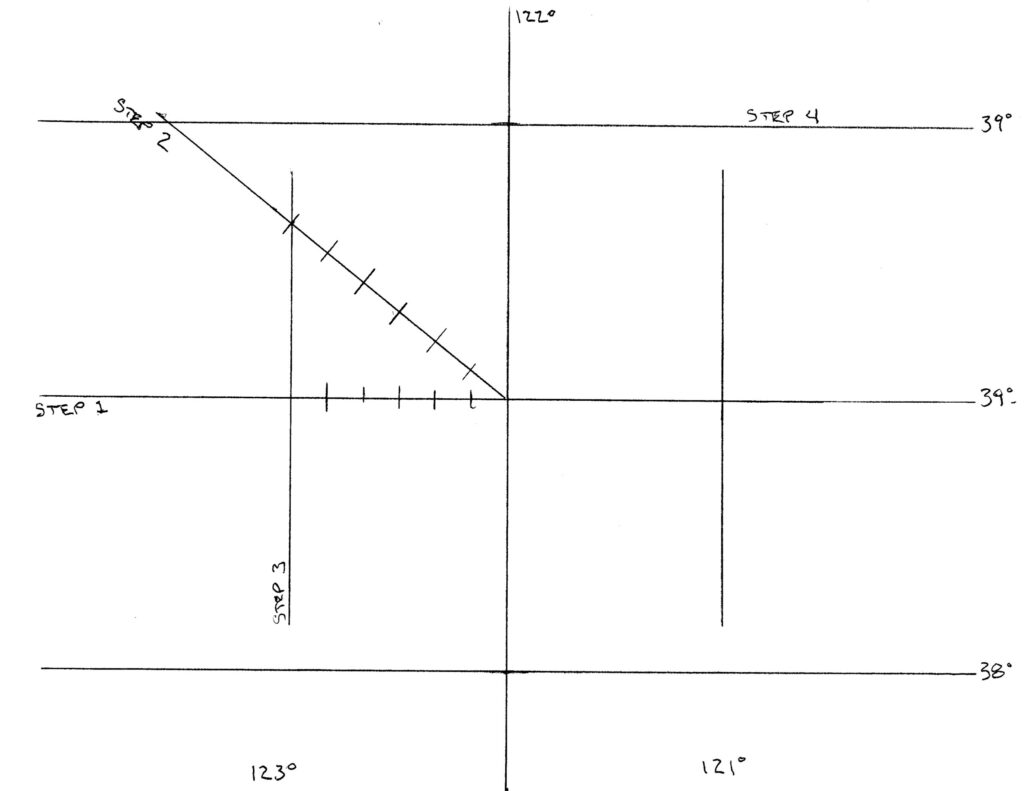
Find The Latitude Lines Above and Below the Primary Latitude Line
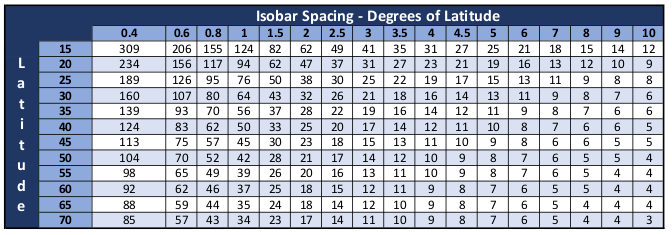
Step Four: Using dividers, measure the length of the oblique line from the center to its intersection with the longitude line. Swinging the dividers so it scribes an arc across the longitude line above and below the center latitude line provides the limits of one degree of latitude above and below the primary latitude line.
Set Up The “Minute” Marks
Step five: Finally, graduate the oblique line into convenient units. In the example, each marking is 2 minutes (miles). And, graduate a section of the latitude line into similar units.
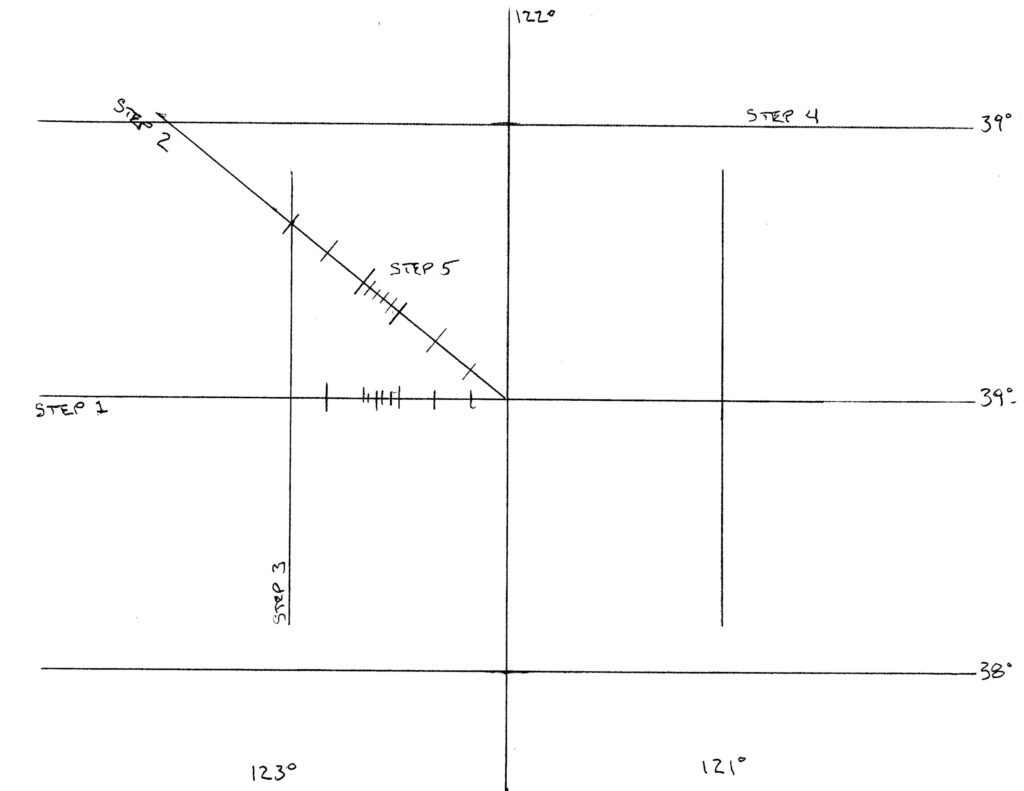
Your Universal Plotting Sheet Is Ready To Use
Good news! You are ready to go. As drawn your plotting sheet covers an area of about 180 mile (E/W) by 130 miles (N/S).
A small amount of practice is all you need to get proficient.
A Final Note
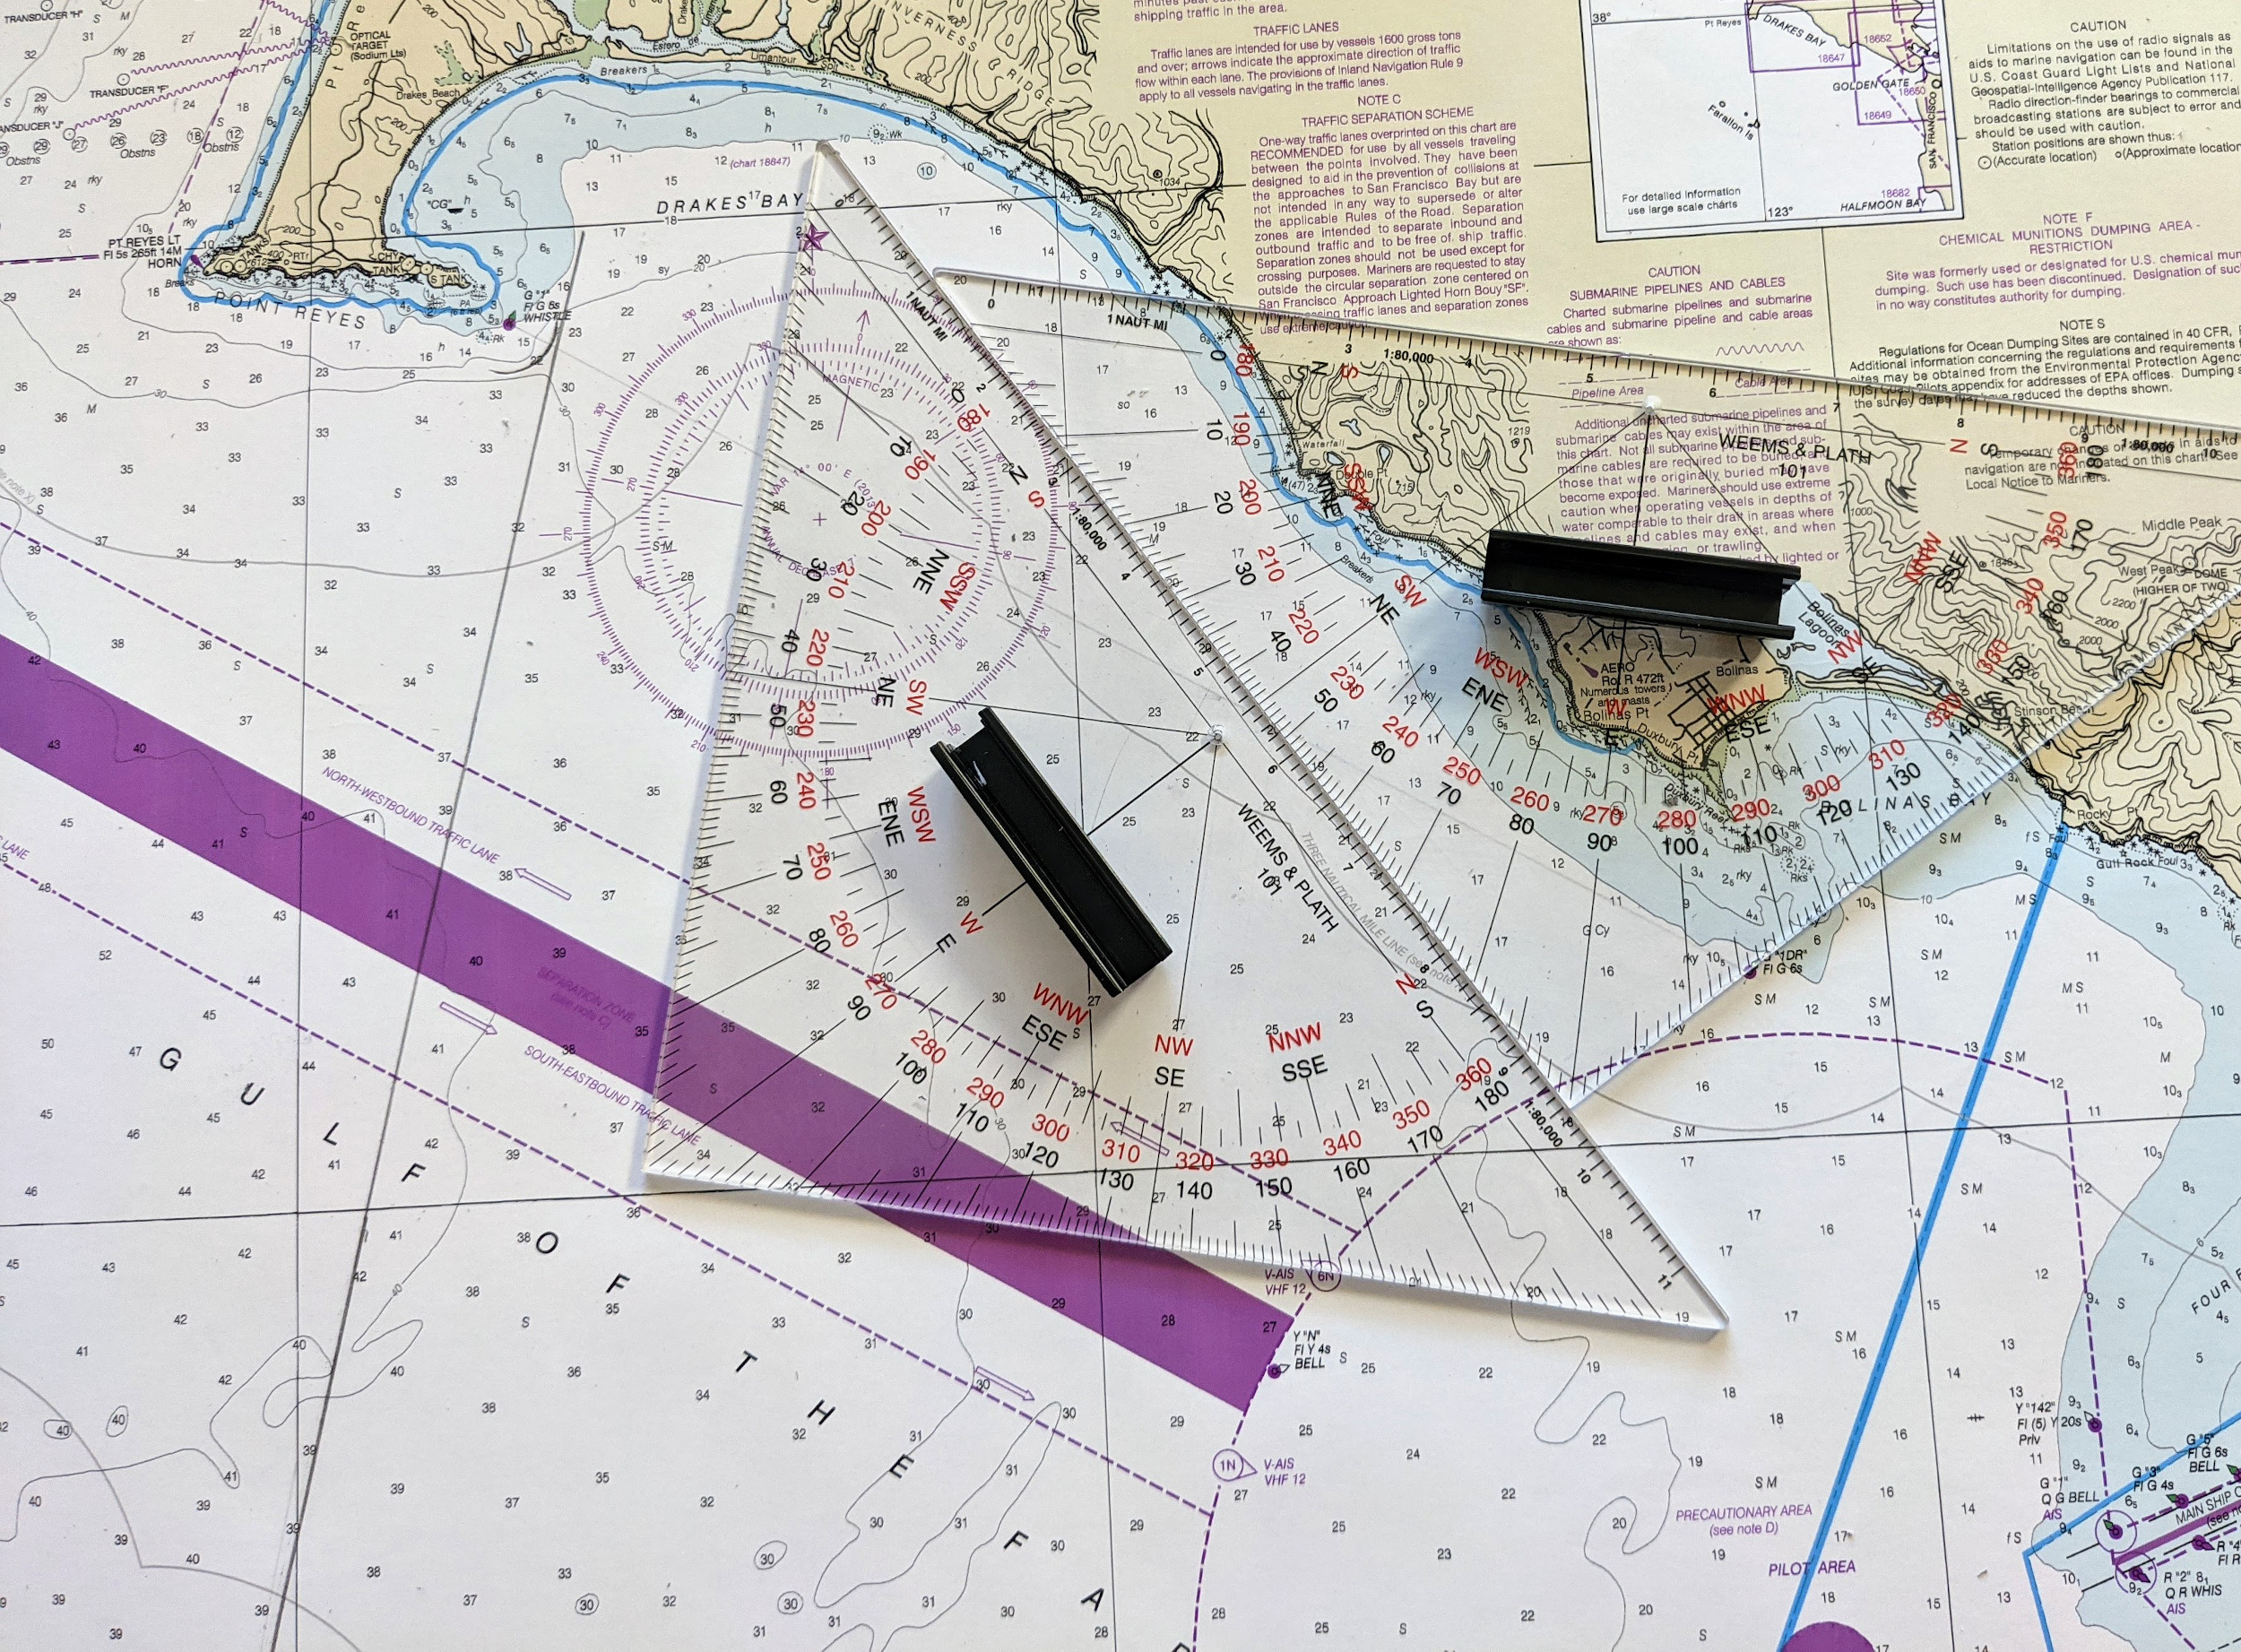
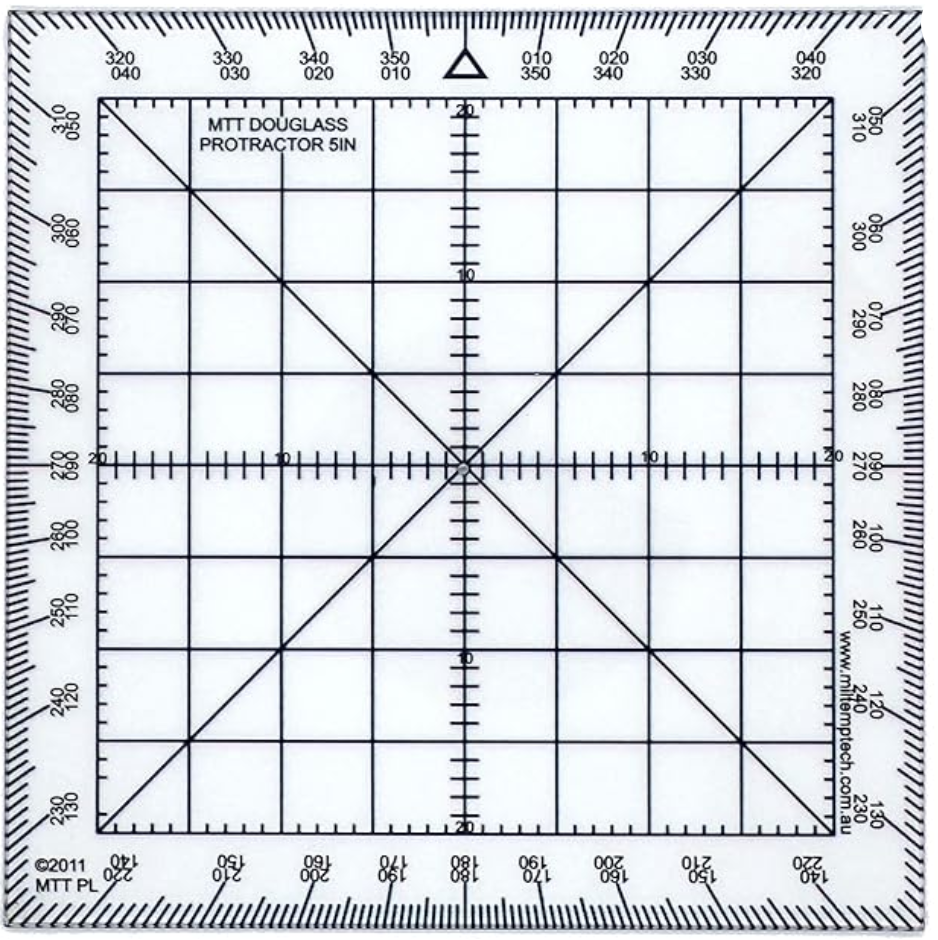
When using a universal plotting sheet, “standard” plotting tools may be a bit unwieldy. My personal preference is to use a 5 inch Douglass Protractor. It seems to be the perfect size to use with an 8.5 x 11 sheet of paper, and is conveniently marked off in 1/2 inch increments. As a bonus, each 1/2 inch is further broken down into 5 divisions, which can be used to represent 2 miles on the latitude scale. With those divisions marked on the plotting sheet is is very easy to interpolate into smaller distances.
-
Pilot Charts
What Are Pilot Charts?
Pilot Charts provide the navigator with averages. Averages concerning prevailing winds and currents, air and sea temperatures, wave heights, ice, visibility, barometric pressure, and weather conditions.
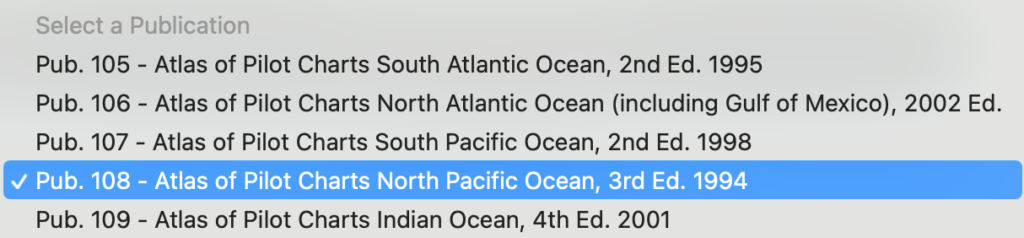
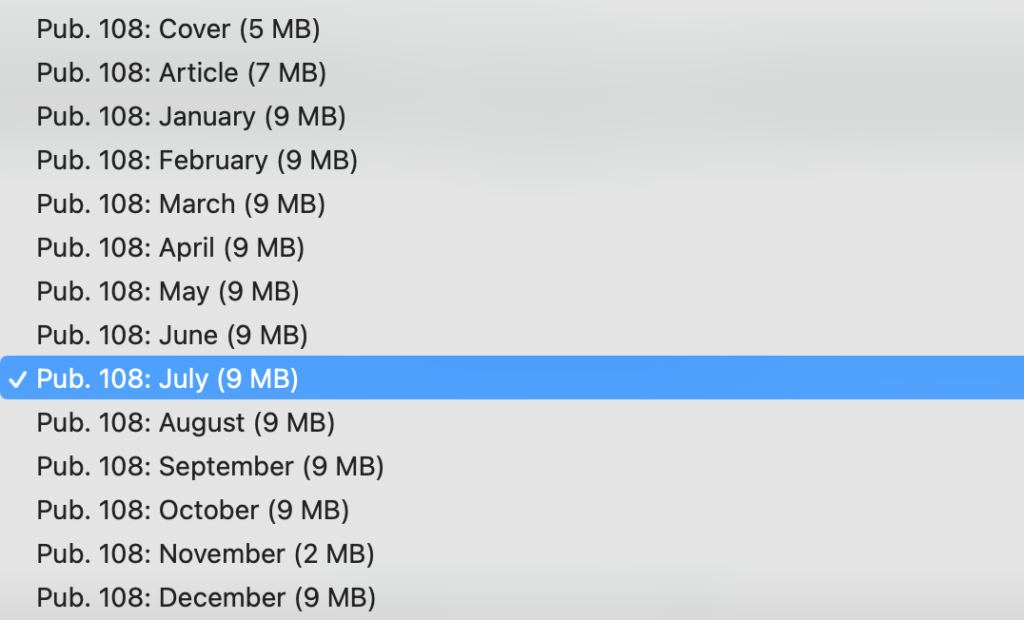
There are five volumes of Pilot Charts, each being its own publication, and each covering a specific geographic region. Each publication is actually a compilation of twelve individual pilot charts, one for each month of the year.
Pilot charts are intended to aid the navigator in selecting the fastest and safest routes with regards to the expected weather and ocean conditions. Pilot Charts are not intended to be used for navigation, however, they are invaluable in planning stages of a voyage.
Coverage Areas
Pilot Charts may be downloaded from the Maritime Safety Information Publications website.
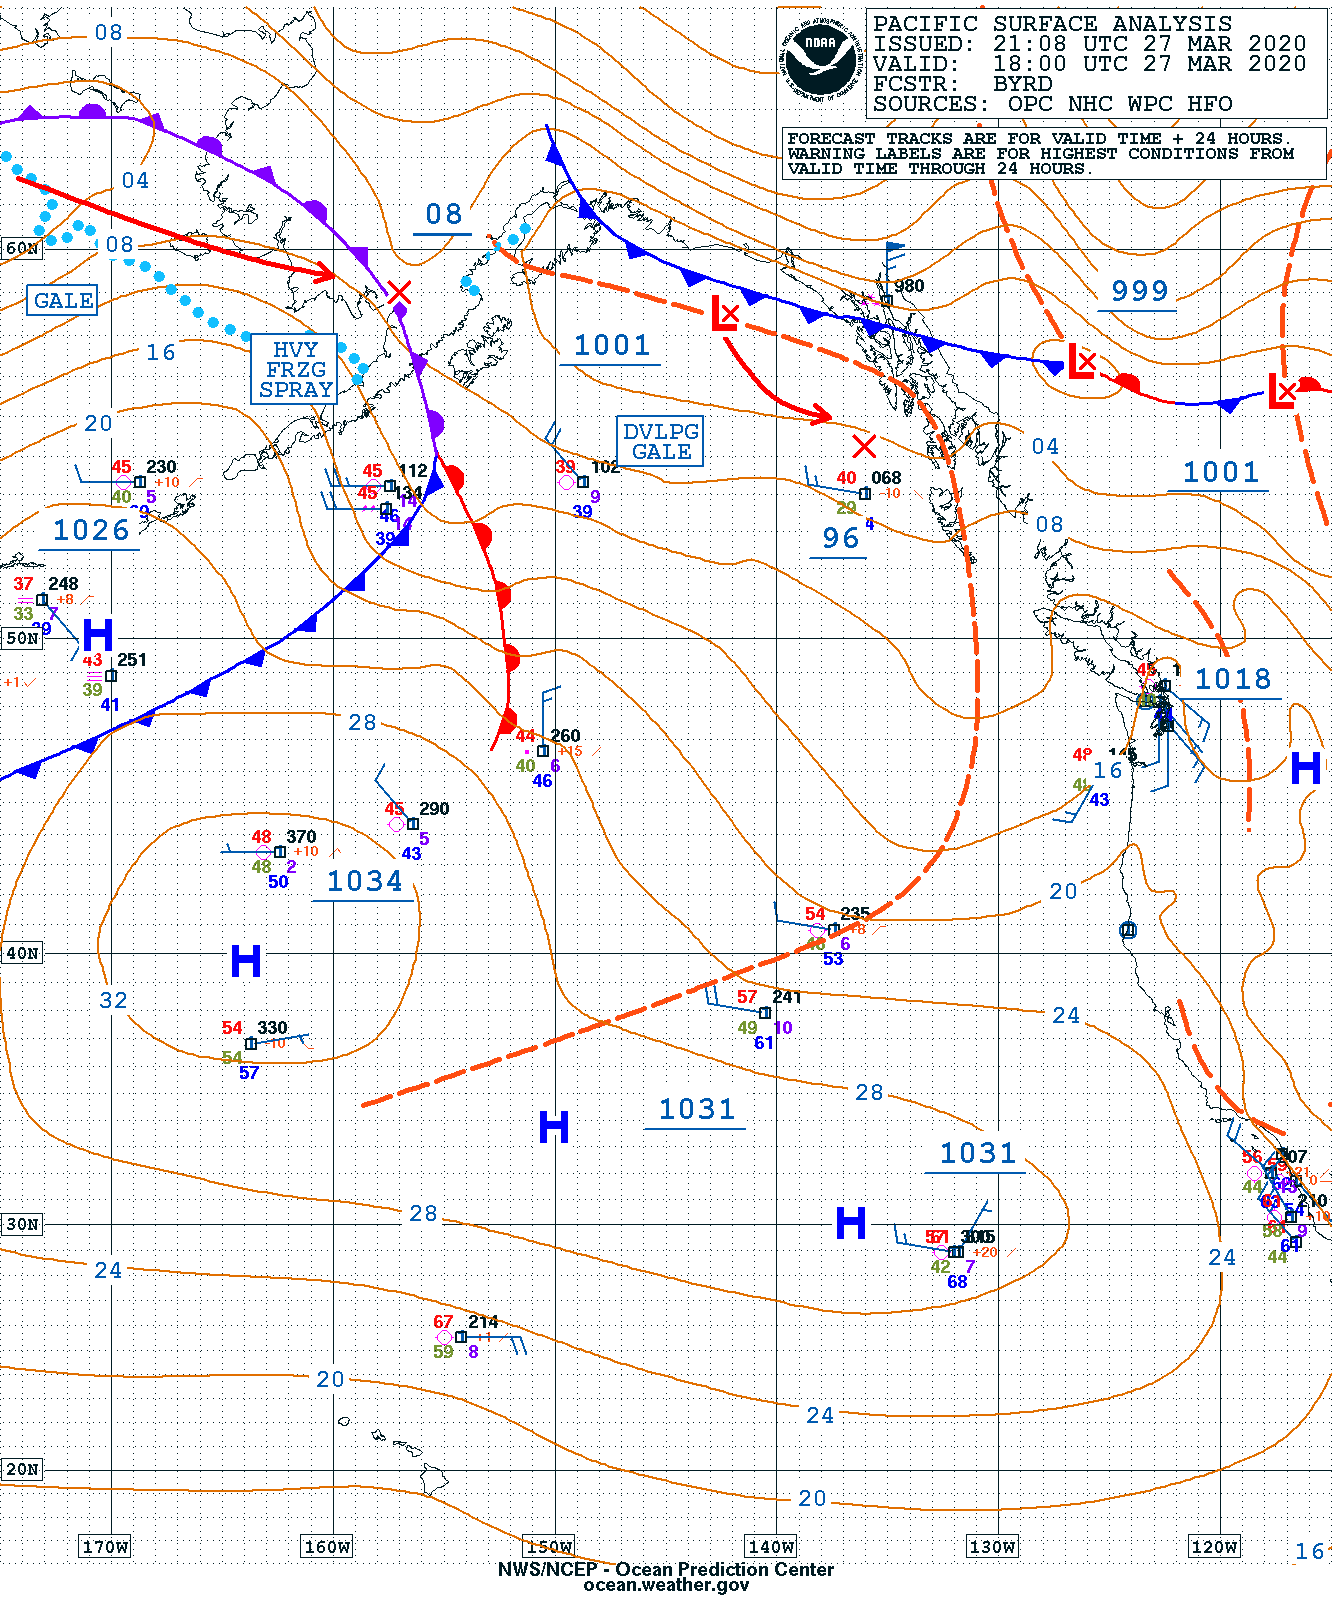
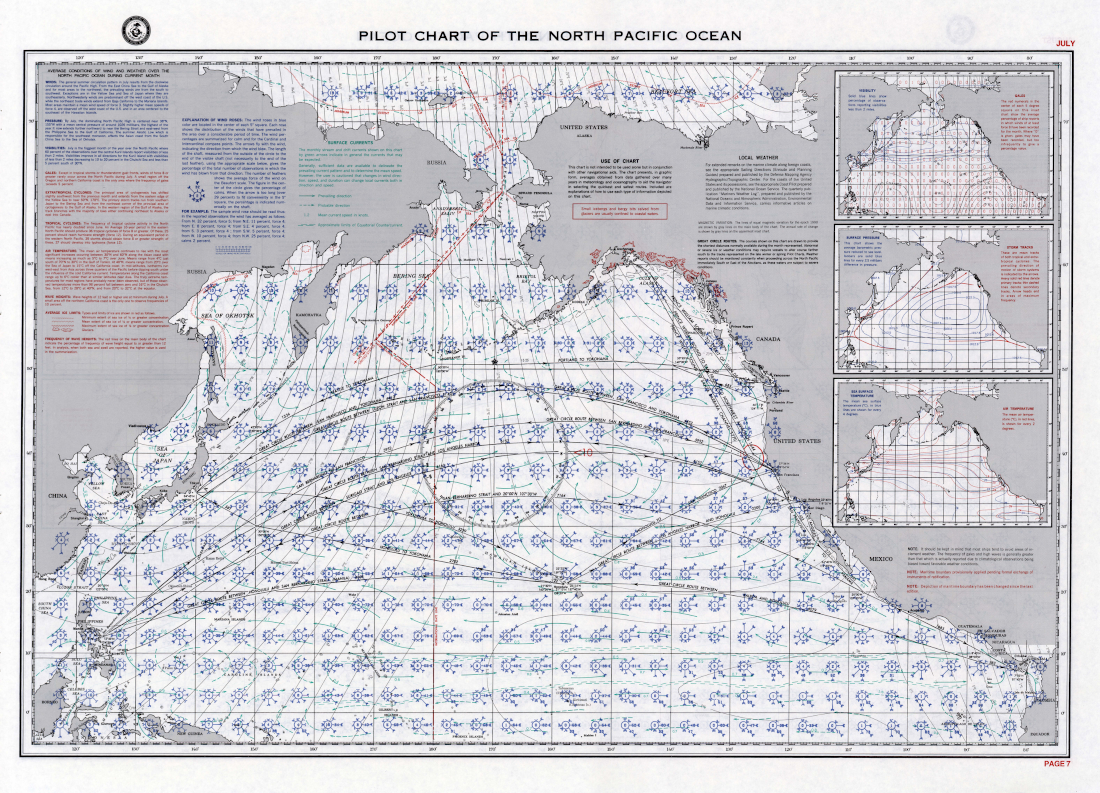
As can be seen in the image below, there is a great deal of information contained in a pilot chart. Most of this information will be explored and interpreted as we move through this post. In this case, we will be looking at average conditions in the North Pacific Ocean in the month of July. One very nice feature of a Pilot Chart is that it not only contains the data, but also instructions on how to use and interpret the data. Pilot Charts are very much self contained.
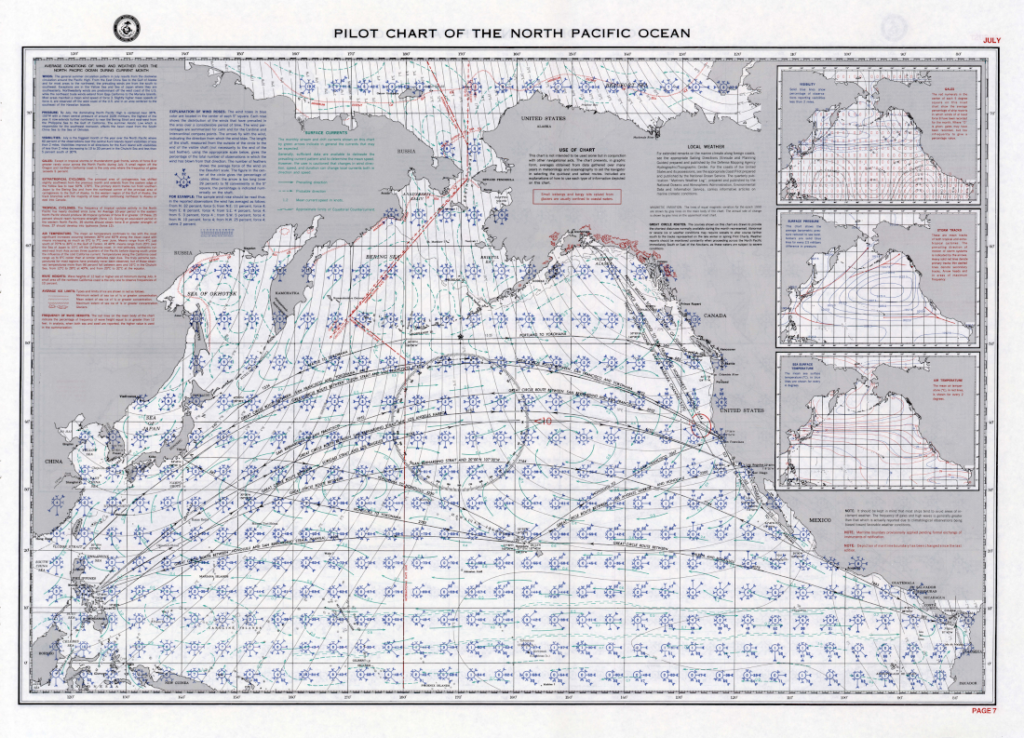
July Pilot Chart of the North Pacific Ocean (108jul) The Main Body of the Chart
Wind Roses
As a sailor who primarily is interested in wind driven vessels, my primary concern when it comes to sailing is the wind. Will there be enough? Too much? What direction will it be coming from.
Fortunately, typical wind conditions is one of the primary pieces of information found on a pilot chart. Every 5 degrees (300 miles), east and west as well as north and south is a wind rose. Understanding the wind rose is critical to proper use of a pilot chart.
Wind Arrows
There is a wind rose sitting just offshore from San Francisco. Because of the land mass and printed information on the chart, it can be a challenge to read this rose, but let’s give it a try. We will start by looking at the wind arrows. There are eight of them, marking the cardinal (N,S,E,W) and intercardinal (NW, SW, SE, NE) compass points. The length of the arrow shaft tells you the percentage chance of wind from that direction (more on measuring it in a minute).
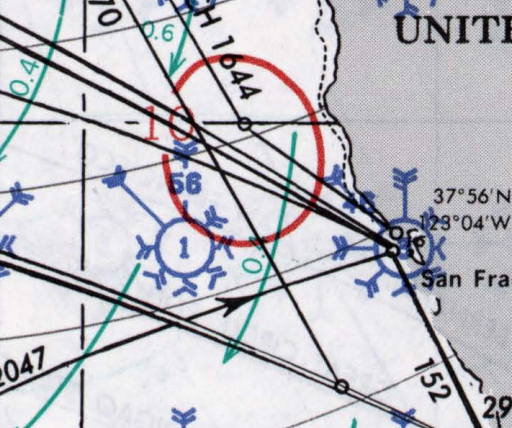
Wind Rose and Wave Height – Pub 108/Jul In this case, the arrow coming from the NW has the number 45 printed on it. Any time a wind arrow is “too long”, it is shortened to a set maximum length and the percent chance of wind from that direction is printed.
Also included as part of the wind arrow are “feathers” arranged on each side of the shaft. There are four arrows, two on each side. The arrows indicated the Beaufort force of the wind coming from the indicated direction. That one arrow now tells us there is a 45% chance of force 4 winds (11-16 knots) coming from the northwest.
The length of the arrows not labeled with percentages can be measured and compared with a scale found on the chart. A quick measurement with dividers provided an 18% change of wind from the north at force 5 (17 to 21 knots).
Calm Days
The final item relating to the wind rose is the number within the circle at the center. In this case, “8”. There is an 8% chance of a calm day (less than 1 knot of wind).
Wave Heights
Before we move to the next graphic, the is one more piece of information found in the graphic above. The red solid line indicates the percentage change of 12 foot or greater waves during the month. Directly off of San Francisco, it is statistically rare, but it may happen. However, a bit to the north there is a 10% chance of 12′ or greater waves.
San Francisco to Cabo San Lucas in November
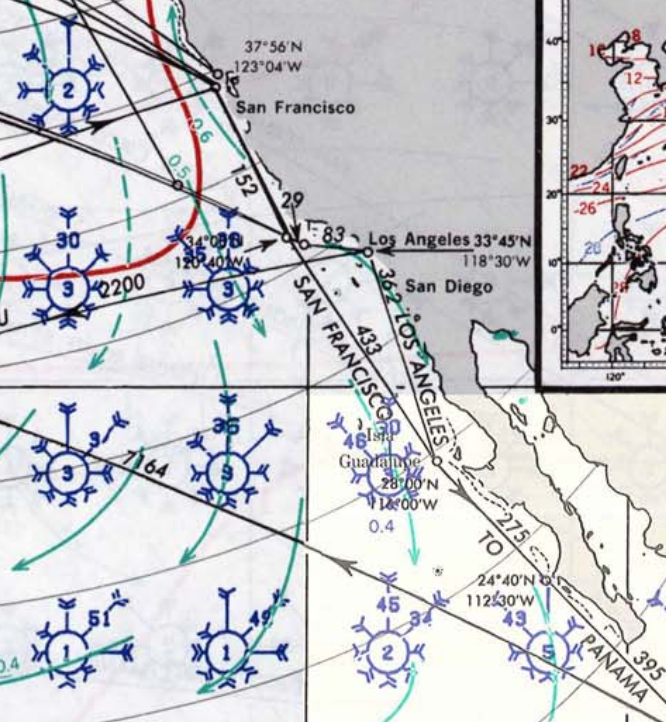
Why is November the most popular time to go from San Francisco to Cabo? Generally no hurricanes and some nice 15 knot winds from the North or North West. Before we move on to the next topic, here is a quick planning exercise for an imaginary trip from San Francisco to Cabo in November.
Off of San Francisco, about 40% of the time the wind will be out of the N or NW at force 4, with calm days expected only 2% of the time. Waves of 12 feet or greater are expected 10% of the time.
Near Los Angeles, the wind will be out of the N or NW at force 4 about 76% of the time.
Nearing Cabo, the prevailing winds are still out of the N or NW over 70% of the time, however, the intensity has dropped to force 1 (1 to 3 knots)
Surface Currents
A new piece of information contained on the chart also presents itself in this exercise. The green arrows represent the expected current in the area. Mostly going down the coast on this trip, currents of .4 to .5 knots will help you on your way. However, if you look close, near shore north and south of San Francisco is a counter current heading north at .6 knots. Staying close to shore could add an extra 4 hours to your trip during the first 200 or so miles.
Two additional topics covered in the main body of the Pilot Chart that may not be of general interest to most sailors are the limits of ice during the month, and a plot of great circle routes (including distance) between a number of major ports. It is nice to know where they are, and the distance from place to place. San Francisco to Yokohama is 4452 and is composed of an arc starting at the 38th parallel, then traveling as high as the 48th parallel before dropping back down to latitude 35.
Average Weather Conditions
In the upper left of the chart is a general text description of the average conditions of wind and weather. Topics covered include:
- Winds
- Pressures
- Visibilities
- Gales
- Extratropical Cyclones
- Tropical Cyclones
- Air Temperature
- Wave Heights
- Average Ice Limits
- Frequency of Wave Heights
Sub Charts
In Addition, graphics of the topics shown above are included.

Sub chart showing percentage of
reduced visibility and gale force winds.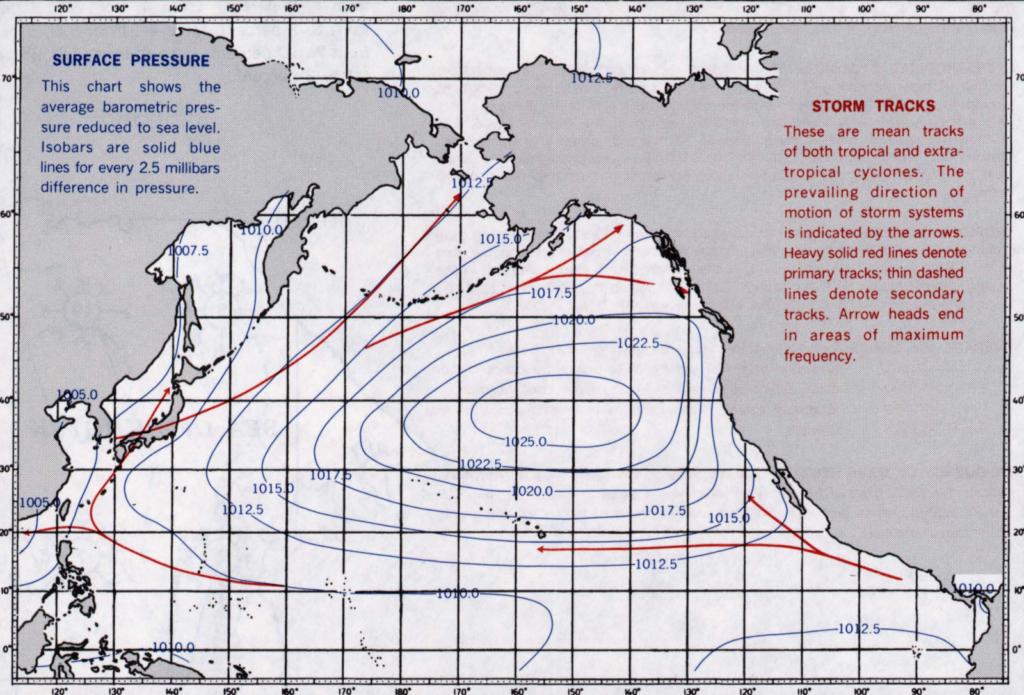
Sub chart showing storm tracks and location of
pressure systems. In this case, the North Pacific High.Air and Sea Temperature
A sub chart is included (not shown) indicating average air and sea temperatures in the area for the depicted month.
Ice Limits
Great Circle Routes
-
Online Glossaries and Resources
Navigation Publications
Office of Coast Survey (NOAA) – https://nauticalcharts.noaa.gov/
USCG Navigation Center – https://www.navcen.uscg.gov/
National Geospatial Agency – https://msi.nga.mil/
NGA Publications https://msi.nga.mil/Publications
NOAA Tides and Currents
Interactive Tide & Current Map https://tidesandcurrents.noaa.gov/
Tide Stations https://tidesandcurrents.noaa.gov/tide_predictions.html
Current Stations https://tidesandcurrents.noaa.gov/noaacurrents/Regions
NOAA Departments Important to Marine Weather
National Weather Service (NWS) https://www.weather.gov/
Ocean Prediction Center (OPC) https://ocean.weather.gov/
National Hurricane Center (NHC) https://www.nhc.noaa.gov/
Storm Prediction Center (SPC) https://www.spc.noaa.gov/
National Data Buoy Center (NDBC) https://www.ndbc.noaa.gov/
Glossaries
National Weather Service Glossary https://w1.weather.gov/glossary/
American Meteorological Society Glossary http://glossary.ametsoc.org/wiki/Main_Page
Data Sources
North Carolina Climate Office Climate Education https://climate.ncsu.edu/edu/home
Ocean Prediction Center Terminology and Weather Symbols https://ocean.weather.gov/product_description/keyterm.php
National Weather Service “How to Read Surface Weather Maps” https://www.weather.gov/jetstream/wxmaps
Wyoming Department of Atmospheric Science Weather Balloon Data http://weather.uwyo.edu/upperair/sounding.html
Storm Prediction Center Weather Balloon Data https://www.spc.noaa.gov/exper/soundings/
National Data Buoy Center Ship Reports https://www.ndbc.noaa.gov/ship_obs.php
National Weather Service “Jetstream” Online Education https://www.weather.gov/jetstream/
Class Aids
Coastal Navigation Class PowerPoint
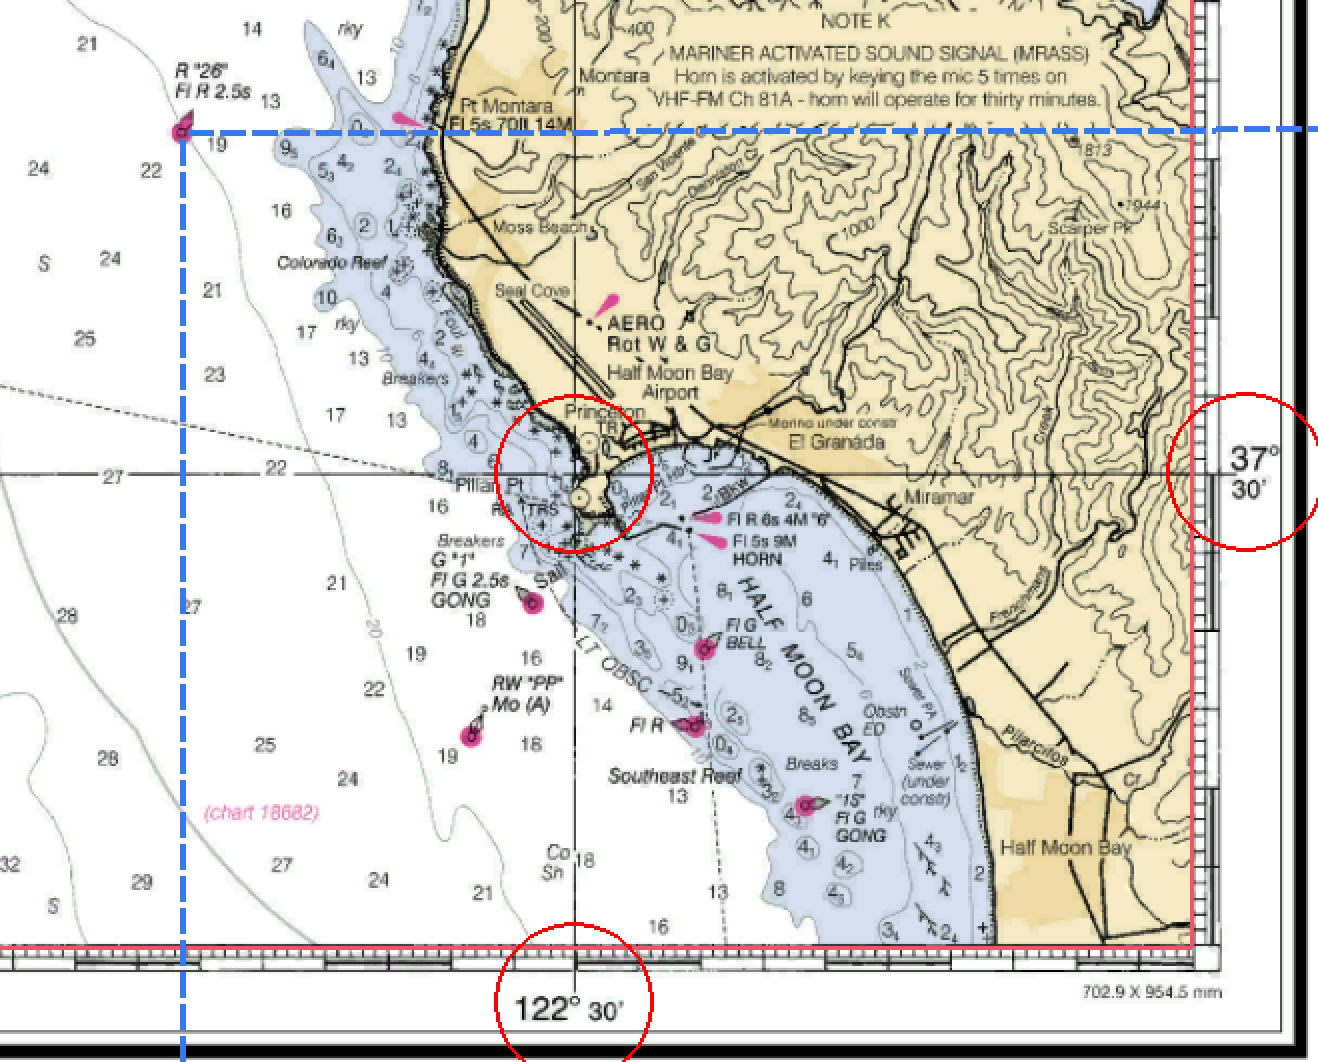
Chart Snippet 18645 (Northeast)
-
Privacy Policy
Who we are
Our website address is: https://tdgil.com.
What personal data we collect and why we collect it
Comments
When visitors leave comments on the site we collect the data shown in the comments form, and also the visitor’s IP address and browser user agent string to help spam detection.
An anonymized string created from your email address (also called a hash) may be provided to the Gravatar service to see if you are using it. The Gravatar service privacy policy is available here: https://automattic.com/privacy/. After approval of your comment, your profile picture is visible to the public in the context of your comment.
Media
If you upload images to the website, you should avoid uploading images with embedded location data (EXIF GPS) included. Visitors to the website can download and extract any location data from images on the website.
Contact forms
Cookies
If you leave a comment on our site you may opt-in to saving your name, email address and website in cookies. These are for your convenience so that you do not have to fill in your details again when you leave another comment. These cookies will last for one year.
If you visit our login page, we will set a temporary cookie to determine if your browser accepts cookies. This cookie contains no personal data and is discarded when you close your browser.
When you log in, we will also set up several cookies to save your login information and your screen display choices. Login cookies last for two days, and screen options cookies last for a year. If you select “Remember Me”, your login will persist for two weeks. If you log out of your account, the login cookies will be removed.
If you edit or publish an article, an additional cookie will be saved in your browser. This cookie includes no personal data and simply indicates the post ID of the article you just edited. It expires after 1 day.
Embedded content from other websites
Articles on this site may include embedded content (e.g. videos, images, articles, etc.). Embedded content from other websites behaves in the exact same way as if the visitor has visited the other website.
These websites may collect data about you, use cookies, embed additional third-party tracking, and monitor your interaction with that embedded content, including tracking your interaction with the embedded content if you have an account and are logged in to that website.
Analytics
Who we share your data with
Data received from you will not be shared.
How long we retain your data
If you leave a comment, the comment and its metadata are retained indefinitely. This is so we can recognize and approve any follow-up comments automatically instead of holding them in a moderation queue.
For users that register on our website (if any), we also store the personal information they provide in their user profile. All users can see, edit, or delete their personal information at any time (except they cannot change their username). Website administrators can also see and edit that information.
What rights you have over your data
If you have an account on this site, or have left comments, you can request to receive an exported file of the personal data we hold about you, including any data you have provided to us. You can also request that we erase any personal data we hold about you. This does not include any data we are obliged to keep for administrative, legal, or security purposes.
Where we send your data
Visitor comments may be checked through an automated spam detection service.
Your contact information
Your contact information will not be shared.
-
Under Construction
This Page
is
Under Construction