A surface analysis is a special type of weather map. The map provides a view of weather elements across a geographical area time based on information from ground-based weather stations and ship reports.
Surface analysis maps are created by plotting or tracing the values of relevant quantities such as sea level pressure and temperature onto a geographical map to assist the location of features such as weather fronts.
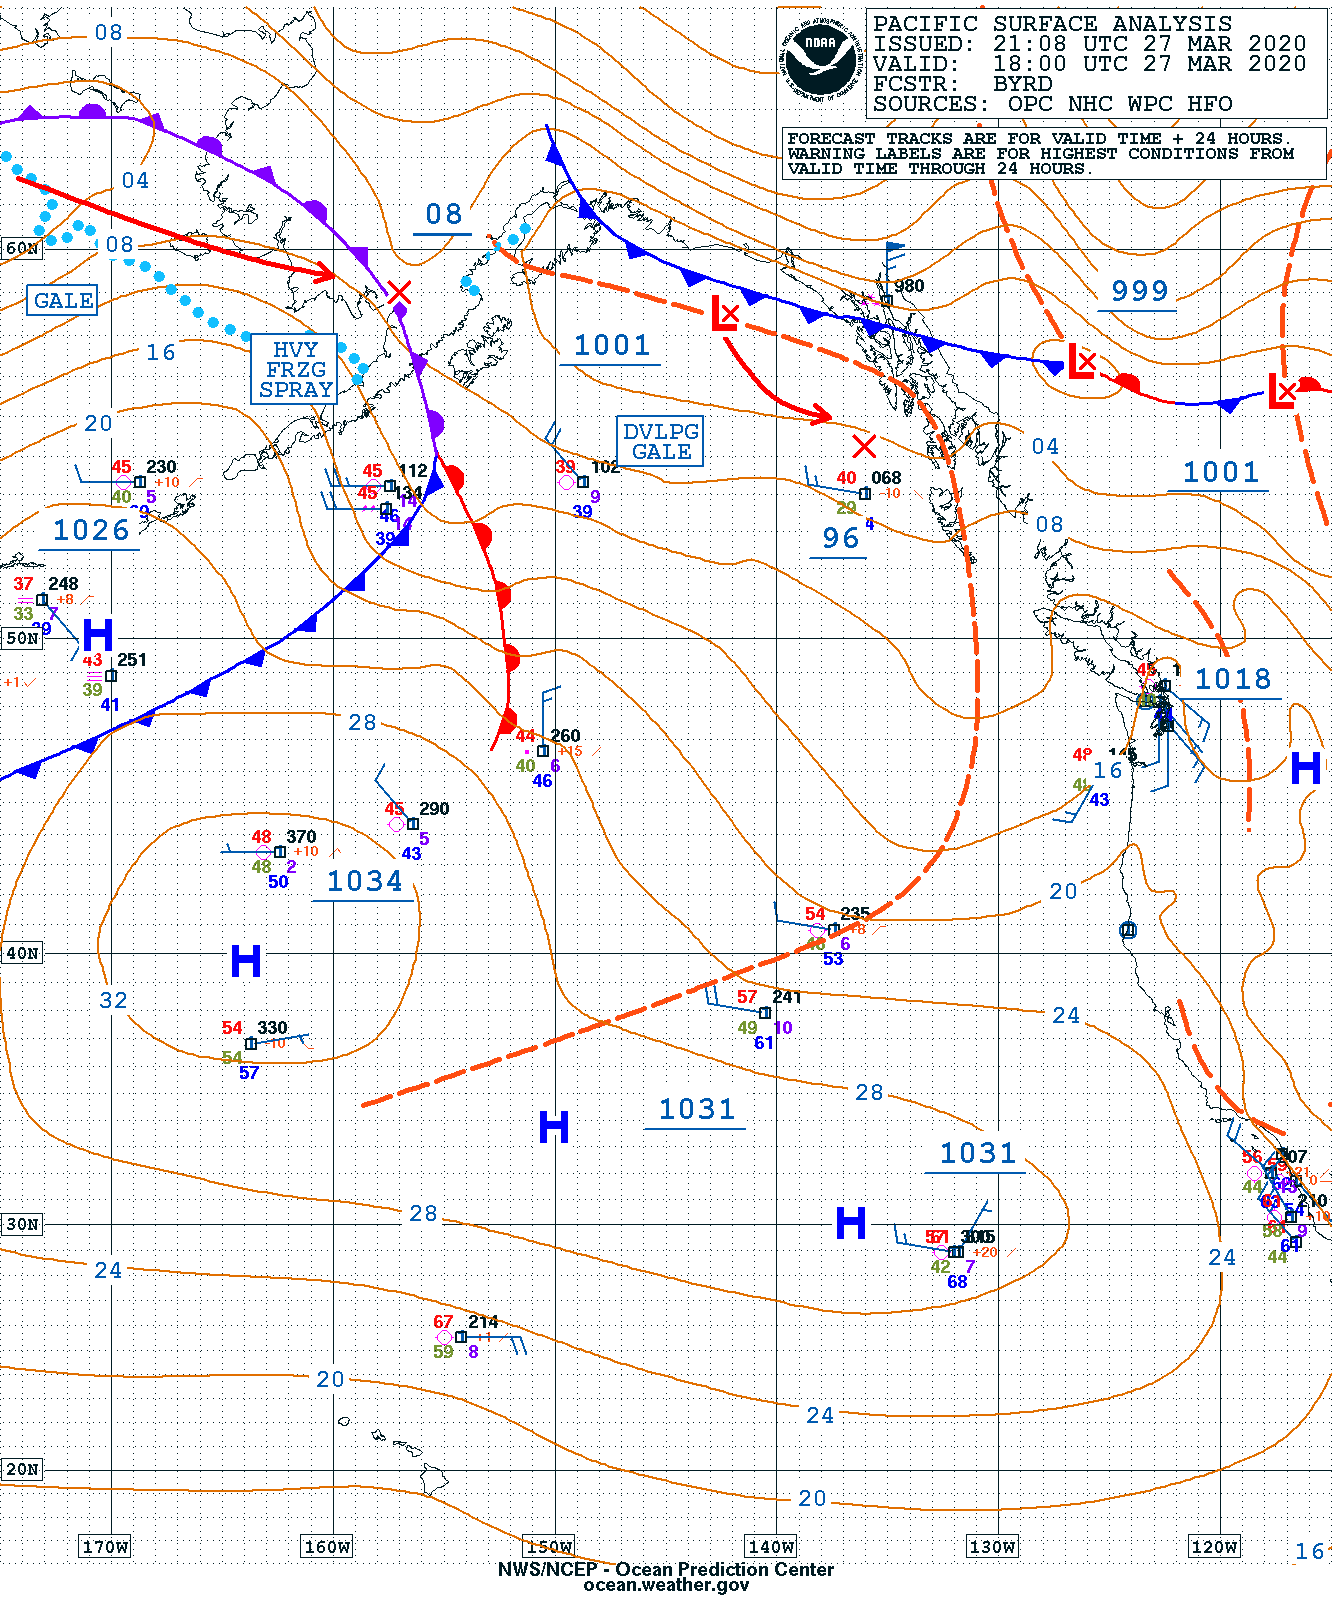
Surface Analysis covering the North-eastern Pacific valid as of 1800 UTC on March 27, 2020.
The title of this topic might have been “What causes the wind.” Quite simply, wind is moving air. Air doesn’t seem like much, however, it has weight and it has substance, and is actually considered a fluid. This becomes apparent when air moves. While moving, you can see many of the same characteristics you might find in a river. Things like moving as a “unit,” parting and coming back together as it flows around an obstacle, and eddies or back-flows.
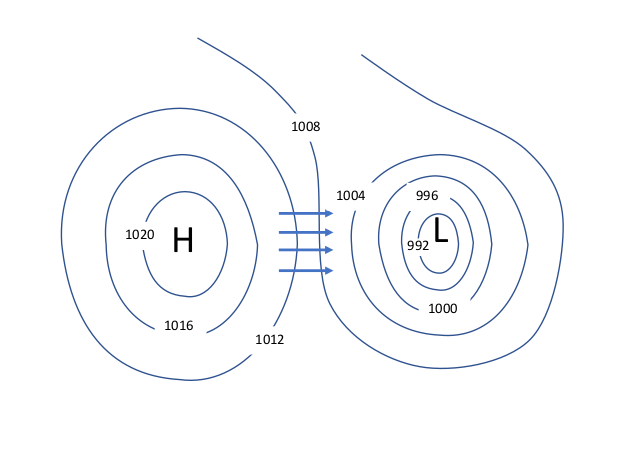
Air moves from an area of higher pressure into an area of lower pressure. The closer together the high and low pressure is and the greater the difference in pressure, the faster the air flows.
Air has weight
The temptation is to believe air has no weight, which isn’t true. Logically, it must have weight. If not, you wouldn’t be able to feel the wind on your face while sailing, and your sails would hang limp even in a fresh breeze.
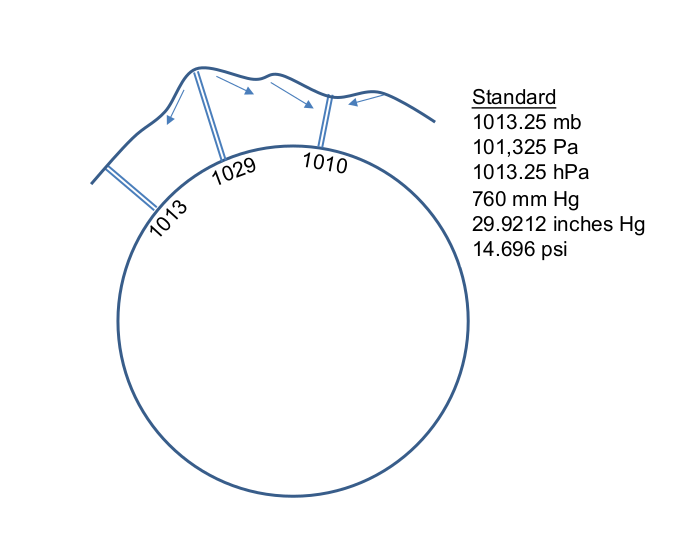
Weight of a column of air
If you weigh the column of air directly above you, it would weigh approximately 14.696 pounds per square inch. This is also known as the standard atmospheric pressure. As the graphic demonstrates, there are a number of labels to use when expressing standard pressure. All represent the same value.
In the maritime world, millibars (mb) are used. Standard pressure in millibars is 1013.25(mb). Throughout these lessons, we will be using millibars to express atmospheric pressure, however, you may have occasion to check weather briefings and forecasts that use other units of measurement. For example, aviation forecasts typically use inches of Mercury (Hg), where standard pressure is 29.9212 inches (Hg).
Atmospheric pressure is also known as barometric pressure.
In the Island in the Sun analogy in An Introduction to Marine Weather, heated air ascended traveling away from where it rose where it was added to the “pile” of air at another location, creating a higher pressure. There are other ways in increase atmospheric pressure in a given area. For example, cold air is heavier the warm air. Moisture laden air is heavier than dry air. Consequently, all of these factors are added together to determine pressure in a given area.
High Pressure vs. Low Pressure
Relatively small variations in pressure determine the wind and storm patterns around the world. The highest pressure every recorded was 1083.98 mb at a location in Siberia. Whereas the lowest, 877.07, occurred in the eye of a South Pacific typhoon. In contrast, most readings fall between 975 mb and 1050 mb, a pressure difference that can easily result in wind speeds in excess of 50 kts!
Air moves from high pressure to low pressure.
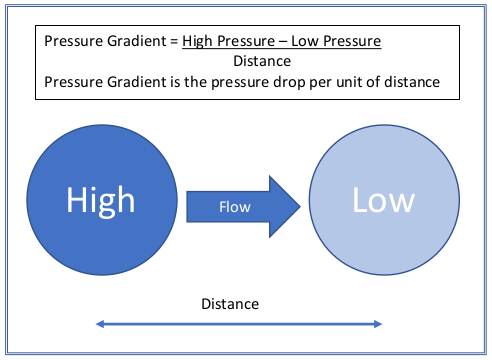
Pressure gradient
Pressure gradient is the change in pressure measured across a given distance. Air flows from the high to the low because the pressure gradient creates a net force that starts the movement of air. The greater the pressure change over a given distance the greater the net force.
Pressure Gradient
Coriolis Effect
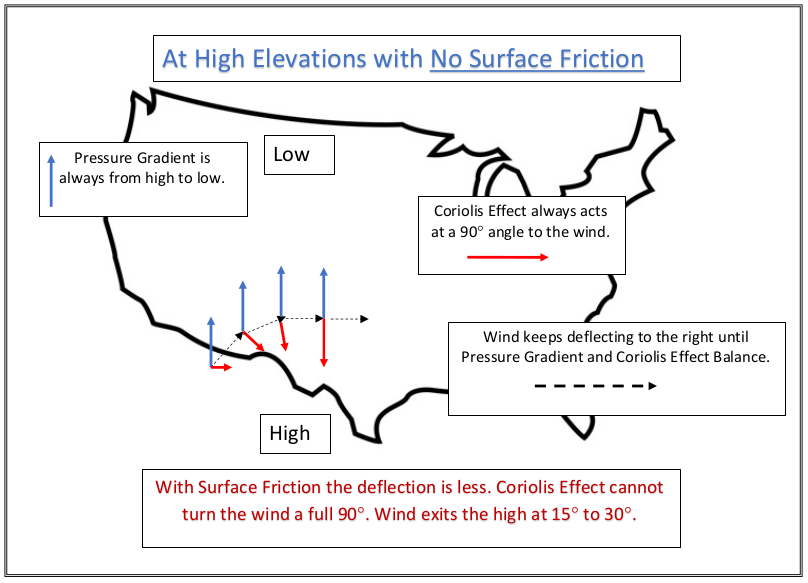
Air moves from higher pressure into lower pressure, however, not in a straight line as demonstrated above. Instead, something called the Coriolis Effect causes the air to deflect to the right around the high pressure area.
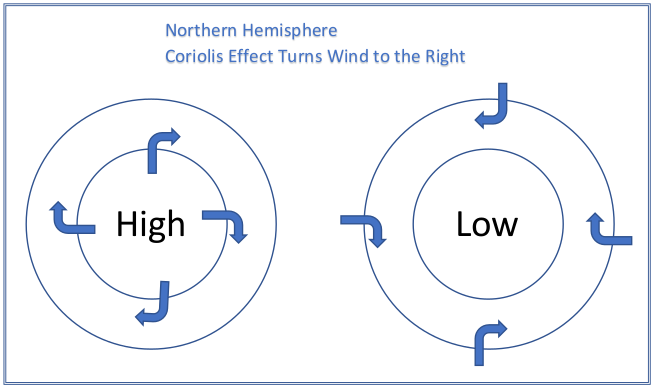
The Coriolis Effect describes the bending of the trajectory of an object as it travels. In the Northern Hemisphere, air that is moving out of a high pressure system towards an area of lower pressure bends to the right.
Wind “starts” in same direction as Pressure Gradient. The Coriolis Effect turns the wind to the right, gradually moving further and further clockwise until the Pressure Gradient and the Coriolis Effect reach equilibrium. At the surface, friction is added into the equilibrium, resulting the the wind moving out of the high at about 15° to 30° before getting parallel to the isobars.
Clockwise Around the High
Here’s some good news. Unless you are a scientist or a mathematician, it really doesn’t matter to weather forecasting? Just remember, in the northern hemisphere high pressure systems rotate clockwise and low pressure systems rotate counter clockwise. The wind travels slightly out of the highs and slightly into the lows.
The opposite is true in the southern hemisphere.
Air flows from higher to lower pressure. Add in the Coriolis Effect caused by the Earth’s rotation and the air flows clockwise (in the northern hemisphere) around and out of a high pressure system into the lower pressure where it rotates counter clockwise.
Around and Out
We now know the net force resulting from the pressure gradient gets the air moving out of the high, towards the low. Once moving, the Coriolis Effect begins to turn the moving air to the right. The air continues deflecting to the right until the net force of the pressure gradient and the turning force of the Coriolis Effect balance each other out. As a result, the air flows clockwise around and out of the high by 15° to 30°.
Isobars
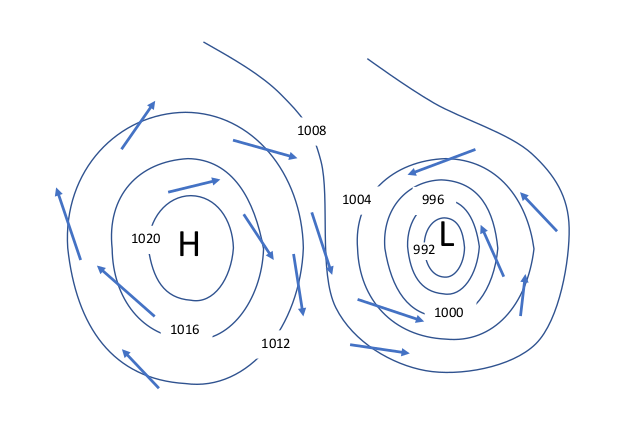
Isobars are the contour lines of atmospheric pressure. They are a series of lines on a map connecting points having the same atmospheric pressure. Each isobar is labeled with its represented pressure, generally with a four millibar spacing.
Surface Analysis covering the North-eastern Pacific valid as of 1800 UTC on March 27, 2020.
In this surface analysis forecast example, a high pressure area can be seen on the left side of the image, slightly below center at latitude 40N. The “H” indicates the center of the high. The expected high pressure there is 1034mb. It’s important to note the “1034” label is underlined, and is not found at the actually location of the highest pressure. In this case, it is slightly above and to the right. The first isobar out from the “H” is 1032mb and includes just the last two digits of the pressure (32). Each successive isobar is 4mb less than the one before; 28, 24, 20, etc.
Moving to the upper right on the map, is a low pressure area with an atmospheric pressure of 999 in the position of the X next to the “L”. Although not marked, the small circle surrounding the “Lx” represents a pressure of 1000 isobars. Take a moment to locate and identify the pressure for each isobar between the areas of high pressure and low pressure.
Knowledge of the weather is as crucial to a sailor today as at any time in the past!
Advances in technology have put weather forecasting capabilities within the grasp of the average sailor. Consequently, with just a few clicks you can bring up tools drawing on the talents of the world’s most knowledgeable meteorologists. Tools unheard of 200 years ago. For example, with a Surface Analysis and a relatively small degree of knowledge, you can foresee and face conditions you find underway.
Providing you with the knowledge necessary to interpret and use the vast array of resources available to you is the goal of Weather in a Modern World.
Below are links to individual modules within the course. Other links to new or expanded topics are found in the individual modules.
Following the outline in order is generally the best method of working through the lesson plan. However, feel free to explore and backtrack whenever you would like.
Back to our island in the sun image. Although not apparent in the image, the rays of the sun do not directly heat the atmosphere. Instead, the sun’s rays heat the land, which in turn heats the air. It’s clear from this small-scale model the sun is the driving force behind the movement of air in this case. But, how about on a larger, global scale. Is the sun still the motivating factor? Yes!
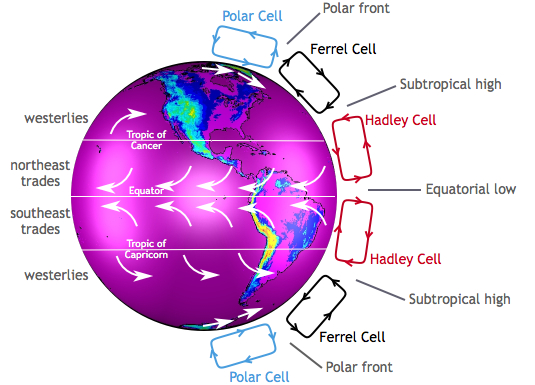
Hadley Cells
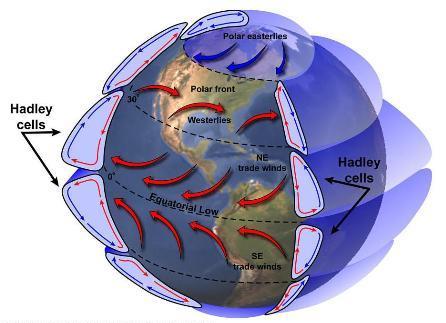
The more directly the rays of the sun impact the Earth, the more energy is transferred, heating the Earth and the atmosphere above it. The sun is located more or less over the equator (more on that later.) The portion of the Earth’s surface near the equator is heated more causing it to rise vertically.
Image by NASA
Hadley cells are the basis for our understanding of global-scale meteorology.
The heated air from the equator begins to move toward the poles and to cool. As the air cools, it begins to descend back to the Earth’s surface. The cooling air descends about latitude 30, causing a “pile” of extra air to end up at that location. This is referred to as an area of high pressure. As the cooled air reaches the Earth’s surface it heads back to the equator. All the while, the Earth is spinning beneath the atmosphere, resulting in wind moving in a more or less Northeast to Southwest direction (in the Northern Hemisphere). These winds are referred to as the Trade Winds.
Known as a Hadley cell this movement of air forms a convection cell that dominates tropical and sub-tropical climates in the lower latitudes (0 to 30 degrees).
Ferrel Cells
Ferrel Cells are an atmospheric circulation cell occupying the mid latitudes (30 to 60 degrees). In this cell the air flows poleward and toward the east near the surface and toward the equator and westward at higher levels., rising around 60 degrees and descending around 30 degrees.
Polar Cells
With a Polar cell, the air rises from around latitude 60 and travels toward the poles. Once over the poles, it sinks, forming the polar highs. At the surface air diverges out and away from the pole. Surface winds blow from the east (polar easterlies).
Image by the Center for Multiscale modeling of Atmospheric Processes.
Global Wind Belts
There are three global wind belts north, and three south of the equator. As mentioned earlier, located close to the equator are the Trade Winds (also known as the Tropical Easterlies), blowing from east to west. Located from around 30° to 60°are the Prevailing Westerlies coming out of the west. Finally, north and south of 60° are the Polar Easterlies.
Bands of High and Low Pressure
Between the Hadley cells and the Ferrel Cells is a band of high pressure at the surface. The high-pressure band is located about 30° North and 30° South latitude. There is also a high pressure area at each pole.
Low pressure bands are found at the equator and 50° to 60° North and South latitude
Hot and dry weather is associated with high pressure. Rainy and stormy weather is associated with low pressure. The region between 50° and 60° latitude (north and south) tends to have more precipitation due to more storms moving around the earth at these latitudes, especially along the west coast of continents. Many of the Earth’s desert areas are located along latitude 30°, and large high pressure areas are found there in the middle of oceans.
Seasonal Changes
Due to the tilt of the Earth, the sun is directly over the equator only twice a year, on about March 20th and September 22nd. During the summer and winter, the sun slowly “moves” north and south of the equator to a maximum of 23.44° north on about June 21, and 23.44° south on about December 21 . The maximum latitude marking the sun’s location is known as the Tropic of Cancer in the north, and the Tropic of Capricorn in the south. The tropics lie between the Tropic of Cancer and the Tropic of Capricorn. North and south of that are the temperate zones.
As the sun moves, the Hadley Cells, Ferrel Cells, and their associated high and low pressure systems also move. The perfect example is the semi-permanent North Pacific High. Center about latitude 30, the North Pacific High moves north in the summer to roughly 38°.
Air Masses
One final topic to introduce is air masses. An air mass is a volume of air covering hundreds or even thousands of square miles. It’s defined by its temperature and water vapor content, and falls into one of five types. Understanding air mass types becomes important later on when we discuss fronts.
Maritime Tropical (mT) air masses form over warm water areas of the tropics, and consist of warm moist air. When you think of Maritime Tropical, think hot and humid.
As the name suggests, Maritime Polar (mP) air masses form over cooler marine environments, and are responsible for cloudy damp weather.
Continental Tropical (cT) Continental tropical air masses are hot and dry. They usually form over a desert area during summer.
Continental Polar (cP) consists of cold and dry air. These often dominate the weather picture across the USA during winter. These air masses are the ones responsible for bringing clear and pleasant weather during the summer to the north.
Except in rare circumstances, a Continental Arctic (cA) air mass is not of concern to the typical sailor. An Arctic air mass is identified by extremely cold temperatures and very little moisture. These usually originate north of the Arctic Circle, however during winter may plunge south.
Knowledge of the weather is as crucial to today’s sailor as it was two hundred years ago.
Fortunately, advances in technology have put weather forecasting capabilities within the grasp of the average sailor, who with the click of just a few buttons can bring up surface analysis maps which draw on the talents of some of the world’s most knowledgeable meteorologists. With analysis in hand, and a relatively small degree of knowledge, every sailor is better prepared to face conditions at sea.
I am not a trained meteorologist. I’m simply a sailor who found a need to learn a little about the weather. A first glance at a surface analysis contains a vast array of confusing symbols and colors. It must require nothing short of genius to interpret. Fortunately, that couldn’t be further from the truth. With a short amount of study, the isobars, high-pressure and low-pressure areas, cold and warm fronts, troughs, and ship reports begin to jump off the page to explain why it’s raining right now. Or, you can expect stormy conditions tomorrow. Therefore, it is a good day to stay at home by the fire. So, enjoy a good book and excellent company.
What is the most important aspect to know about the weather?
Ask this question of five sailors in a bar, and you will likely get six different answers, mostly focused on storms. Not true. Knowing the wind is the number one factor a sailor can know. Will there be too much or too little? Interestingly, too little is more often the case, and part of the task of a good navigator is to plan the route that offer the best wind for the sailing destination in mind. Whether that destination is a day sail on San Francisco Bay, or a Pacific Puddle Jump from Mexico to French Polynesia, understanding where the wind is, and effects of land and latitude go a long way to making the voyage safe and enjoyable.
My goal with this website is to aid you in becoming a knowledgeable navigator.
Each article is designed to further your education. In effect, it is an online training class composed of blog posts, videos, and practice exercises. Each post is topical. In chronological order, we explore weather beginning on a global scale. Going from high level to a detailed view, we look at all aspects of weather, right down to local effects. For example; why does wind typically blow from the Northwest along the central coast of California? However, why does it suddenly change to a Southwest wind in San Francisco Bay? How is that same wind is impacted by Alcatraz Island sitting the middle of the bay.
All weather is based on the relationship of the Sun to the Earth.
Warm air rises. Cool air sinks. The Earth “rotates under the Sun.” Driving all of the weather patterns we experience. Let’s start our weather education with a simple drawing of a large scale process scaled down to size.
An Island in the Sun
A great deal of information is found in this simple image. Some of it is obvious, and some not.
The sun heats everything, however, land heats faster than water.
Warm air rises. In this case, the “packet” of air directly above the island moves upward.
Warm air is able to hold more moisture than cooler air.
Wind is the movement of air from one place to another.
As the packet of warm air rises, it begins to cool back down.
When the packet of air cools to a certain point (called the dew point) it condenses into clouds.
At some point, the cooling air begins to move away from the newly arriving warmer air.
The cooled air begin to sinks, replacing the cool air moving toward the island.
The rising warmer air over the land creates an area of lower pressure (less air).
The sinking cool air creates an area of high pressure (more air).
Here’s another visual for you. The packet of air above the island is like a hot air balloon. As the air inside warms, the balloon rises. Just like the air in the balloon the packet of air rises as a unit. Warming, rising, condensing, and moving away from the source of the heat more or less as a single unit.
That’s enough for now. In the next post, we look at the same process on a global scale.