A quick review
The first half of this lesson is a review of pressure gradient, Coriolis Effect, and wind speeds. For a more complete discussion refer to the High and Low Pressure Systems lesson.
Pressure Gradient
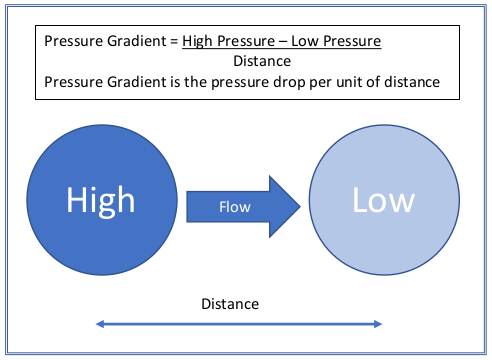
Pressure gradient is the change in pressure measured across a given distance. Air flows from the high to the low because the pressure gradient creates a net force that starts the movement of air. The greater the pressure change over a given distance the greater the resulting net force, and the greater the air flow (wind).
Pressure Gradient 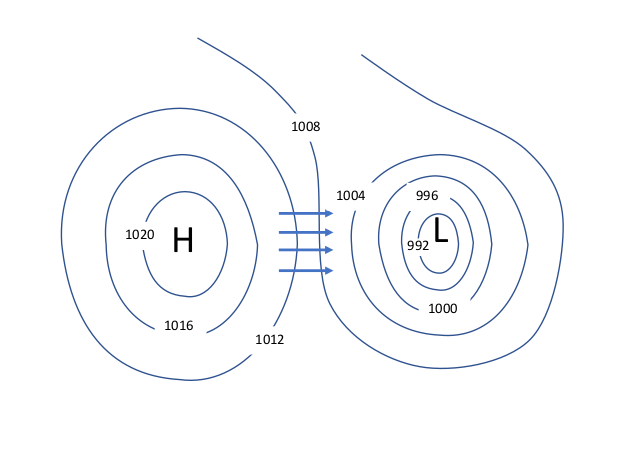
Air moves from high pressure to low pressure.
Coriolis Effect
As air moves from higher pressure into lower pressure, the Coriolis Effect causes the air to deflect, or turn to the right in the northern hemisphere and to the left in the southern hemisphere. The deflection is always in relationship to the air’s direction of travel. Unless otherwise stated, we will assume we are in the northern hemisphere.
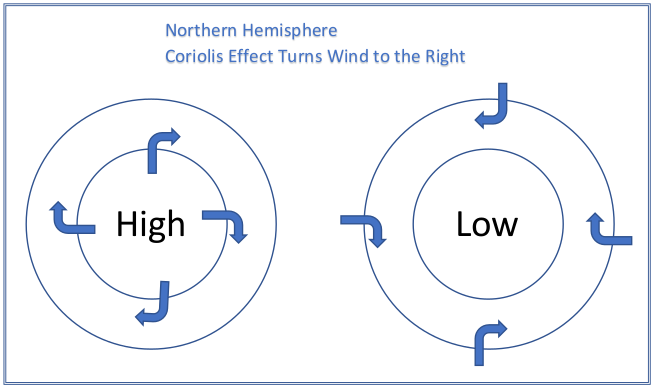
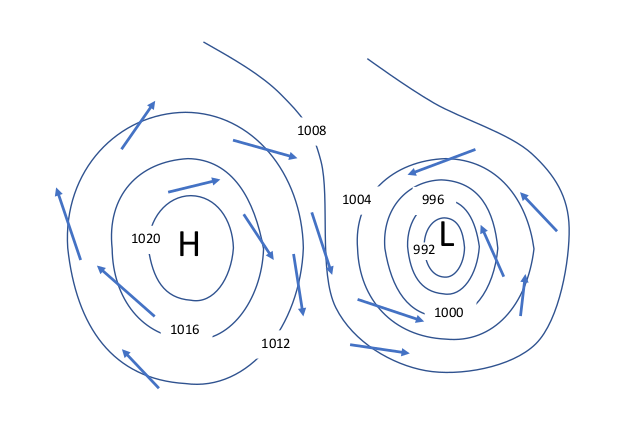
A higher elevations, wind “starts” in same direction as the Pressure Gradient. The Coriolis Effect then turns the wind to the right, gradually moving further and further clockwise until the Pressure Gradient and the Coriolis Effect reach equilibrium with the air moving at 90° from the pressure gradient which is parallel to the isobars. In contrast, friction is counted in the equilibrium as the wind reaches the surface. The resulting wind does not make it quite 90°. The wind moves out of the high, but at about 15° to 30° across the isobars.
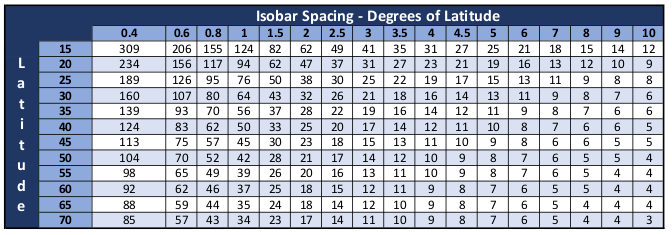
The closer the isobars, the higher the wind speed
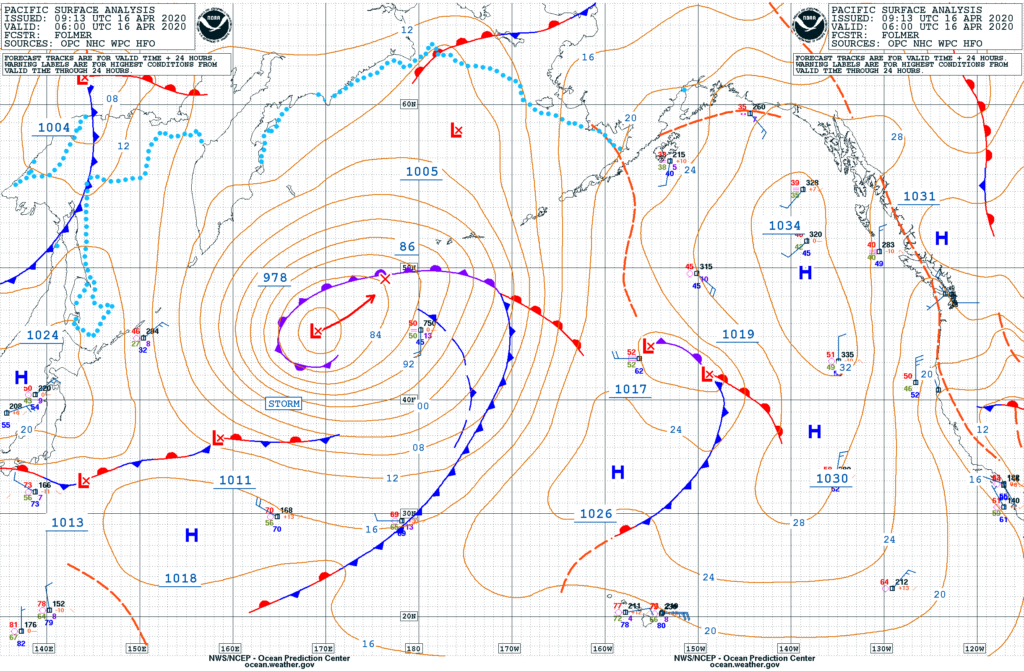
The isobars are very close together near the low pressure system just to the left of center (Lat 40° N; Lon 165° E) in the above surface analysis. The closer together the isobars, the higher the pressure gradient, and the stronger the wind. At their closest point, the isobars measure about 1 apart. At that latitude, 1° isobar separation indicates winds of approximately 50 kts (see the table below). This estimate is verified by the STORM warning placed at the location. Storm force winds range from 48 knots (55 mph) to 63 knots (73 mph).
Calculating Wind From Isobars
Measurement of isobar spacing provides a rough estimate of expected wind speeds. To use the table, measure the distance between isobars in degrees of latitude. Enter the table along the top row using that measurement. Find the closest latitude to the area of interest and follow that row. The intersection is the estimate of wind speed in knots.
Estimating Wind Direction
At upper altitudes, air flow is essentially parallel to the isobars. This knowledge is of little use to the sailor. Instead, wind direction at the surface is the concern. Remember that air flows clockwise around the highs and counterclockwise around the lows. It also flows out of the highs and into the lows. Consequently, if you measure the direction of the isobars and subtract 15° to 30° you have an approximate direction the wind is heading. For example; if the isobar direction is 180° at your location, expect the wind to be heading towards 150° to 165°. For simplicity, I would use 160°.
Conversely, add 15° to 30° when looking at air flow around a low.
Where is the wind coming from
It’s critical to understand that wind heading in the direction of 160° is coming from 340°. Wind is always labeled by its source, not its destination. This wind would be coming from the North Northwest (NNW), and would be labeled as such in any forecast.
Is there a simpler way
In practice, it is really quite simple. Lay a parallel ruler alongside the isobar. Rotate it 20 or so degrees out of the high or into the low and you have your wind direction.
Backing and Veering
Wind direction is constantly changing. When the wind changes direction to clockwise it is referred to as veering. It backs if it changes in a counter-clockwise direction.
Wind from 315 that shifts to 330 has veered. If it goes to 300 it has backed.
Apparent Wind vs. True Wind
True wind is the air movement you would feel if you are not moving. There are two dimensions to describing wind, speed and direction. For example, NW at 15kts, indicates wind coming from the northwest at 15 kts.
Apparent wind is the speed and direction wind seems to be coming from when you are moving. Thus, it is the sum of air movement and vessel movement.
Here is a visual. If you are stopped at a stoplight while riding a bicycle you feel true wind. Lets say that’s 5 kts of wind from directly in front of you. When you start moving, the wind will seem to increase with your speed. When you are moving at 5 kts, you will feel 10 kts of wind. At 10 kts, you feel 15 kts.
On the other hand, if the 5kts of wind is coming from behind, when you reach 5 kts of bike speed you will feel zero wind. At 10 kts of bike speed, you will feel 5 kts, and it will have changed direction to coming from the front.
A sailboat sails to the apparent wind.
Apparent wind is always forward of true wind
The movement of a vessel always rotates the apparent wind forward of the true wind in relation to the vessel. It the apparent wind is forward of the beam, apparent wind speed will be higher than true wind speed. If aft of the beam it will be less than true wind speed.
Plotting true or apparent wind
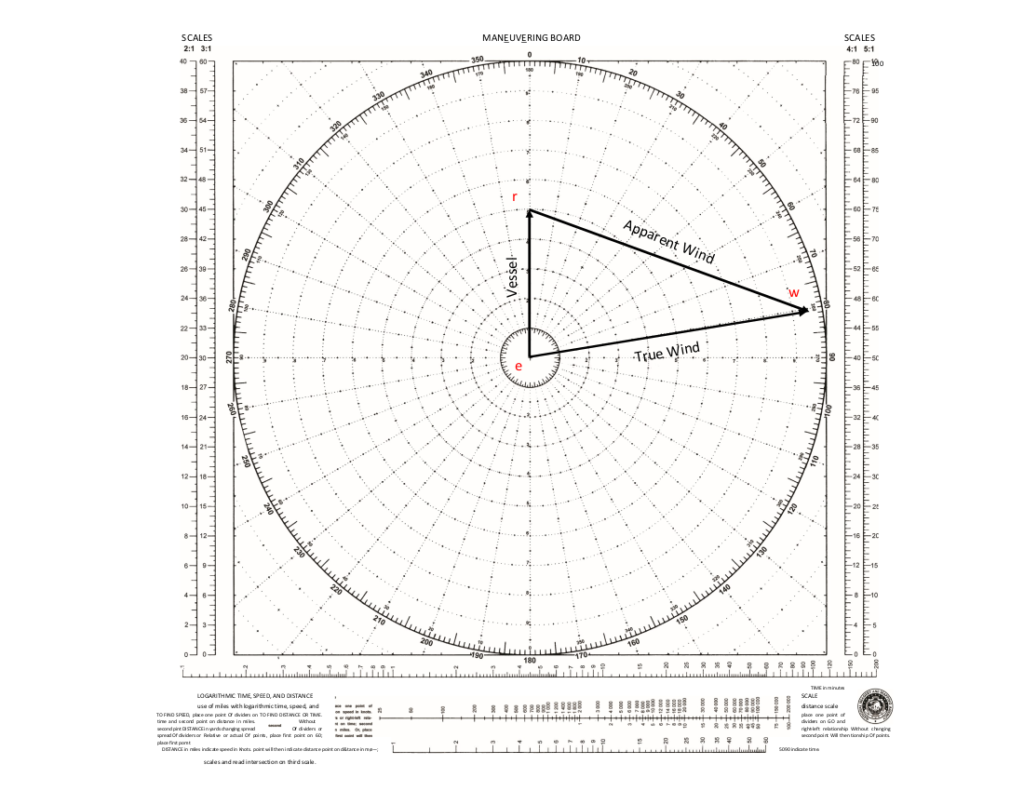
Vectors can be plotted on a Maneuvering Board to determine apparent wind or true wind the other is known.
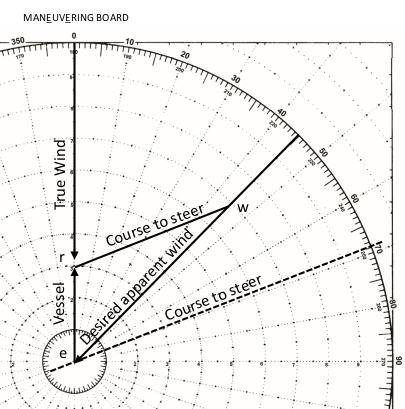
- Vessel course and speed are plotted first. In the example below, vessel is heading 360 at 5 kts. Point “e” is the vessel start point. Point “r” is the vessel location at end of a “one-hour” time.
- If apparent wind is known, plot direction and speed beginning at point “r” and ending at point “w”. In the example, apparent wind is from 290 at 10 kts.
- Plot the true wind vector “ew” to find the speed and direction of the true wind. True wind is from 261 (read off the inner degree scale) at about 9.5 kts.
- If looking for what apparent wind to expect, plot the vessel’s vector, then the true wind. Relative wind can now be determined.
Course to steer to achieve desired apparent wind direction
The first thing you need. to know in order to determine course to steer is; “What is the closest my vessel will steer to the apparent wind?” For this example, let’s assume 45°.
- First, assume your vessel is heading directly into the wind and draw vector ‘er’, your vessel, at 000. remember that “e” is generally located at the center of the plot.
- Draw the 45° apparent wind vector that you would like to achieve. In this case you don’t know the speed, so draw the vector from “e” to the furthest edge of the plotting circle.
- Set your dividers to the length of the wind speed. Scribe an arc centered on point “r”. The intersection of the apparent wind vector and the scribed arc is “w”. Vector “rw” is your course to steer in degrees “off” the wind. In this case, 069.
You may have noticed the Vessel course and true wind vectors are both on the 000 line. In practice, you may either show them both, or leave out the true wind vector. It isn’t needed in the calculation.
Now, apply the 069 course calculation to the actual true wind. If for example, the wind is from 315, steering a course of 246 puts you on a starboard tack with the apparent wind 45° off the bow. Conversely, a course of 024 results in a port tack with the same 45° apparent wind.
Next: Air Masses