
What Happened
In November of 2019, NOAA announced that they would be “Sun setting” traditional production of all raster chart products. In other words, production of traditional NOAA paper charts and all raster products will be completely ceased by January 2025.
Since that time, NOAA has been slowly and surely moving toward that goal. For example, support for the Lake Tahoe Chart (18665) ended on August 26, 2021, the Gulf of the Farallones (18645) cancelled October 5, 2022, and the Entrance to San Francisco Bay (18649) cancelled on July 31, 2024. The last of the raster chart products was cancelled in December of 2024.
Raster vs Vector (ENC) charts
I am probably not the best person to discuss the difference between raster and vector charts, however, in simplified terms, with a raster chart you get what you see. All the pixels are drawn and set in place as part of the file. Zooming in gets you a closer visual, but does not reveal any additional data.
Vector charts are digital data, storing “features” as pairs of latitude and longitude coordinates. Records associated with each feature provide detailed information, such as the feature’s color, shape, purpose, quality of position, and other attributes.
With vector charts you can zoom in or out of the file image. As you do so, more or less detail is uncovered. For example, on one zoom setting you may see where a line of lateral marks lining a channel is located. Zooming in one more step may reveal charted depths in addition to the mark locations.
ENC Chart Numbering
At first glance, the numbering system used for the new vector charts is mind numbing. Fortunately, with a little understanding of the system it makes perfect sense! Each ENC chart (or cell) is given a unique 8 digit identifier following strict international guidelines.
An example of an ENC cell name is US4CA11M. The first two digits (US) indicate the producer of the chart, in this case, the United States.
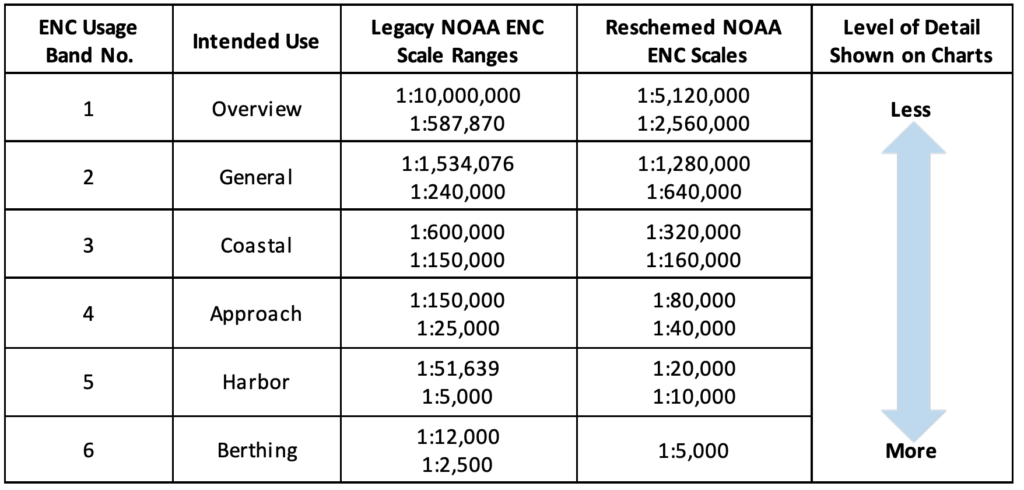
The third digit is a number from 1 to 6 that identifies the navigational purpose of the cell. ENC cells identified by the number 1 show the largest area with the least detail. As the number increases, the size of the area covered decreases while the detail increases.
“The Chart Number”
The next 5 digits are a unique alpha numeric identifier, much like the old chart identifier system. However, each producer has the ability to design the layout of this number to fit its needs. In the United States, cells will include an “area reference” as the 4th and 5th digits.
The 6th and 7th digits are a cell sequence number similar to chart 1, 2, 3, 4, etc., typically in order of creation.
The final digit is generally a letter. In most cases the letter is M, however not always, and I have not been able to find a legend of what the various final digits mean. One source I found says the “M” means the soundings are stored in the file in meters, even though they may be printed in other configurations.
The 4th and 5th “area reference” digits for a purpose 1 or 2 cell will have an identifier like WC for west coast or EC for east coast. Purpose codes 3 through 6 have an area reference identifier more specific to the area the cell covers. For example, CA, OR, or AK.
The cell example above, US4CA11M, indicates it is a US chart, with an approach purpose (scale between 1:150,000 and 1:25,000. It covers California waters, and is the 11th in the sequence.
Viewing ENCs
Unfortunately, it isn’t the purpose of this tip to explain how to use ENCs. However, it’s important to know that in order to view an electronic chart, you must have some type of electronic chart viewer. I know, that statement is so simple as to seem pretty dumb to say. But, it is true.
There are a number of electronic chart viewers available to you. The only one I have any experience with is OpenCPN which is a full navigation program, capable of downloading and displaying Raster and ENC charts on windows, mac, and various linux based systems.
If you have access to the internet, NOAA includes a chart viewer that is accessed through https://nauticalcharts.noaa.gov/.
NOAA Custom Charts (aka NCC)
Knowing the value of printed charts, NOAA created a tool where PDF files can be created using data from ENC charts that are very similar in look and function to the “old fashioned” raster charts. Smaller charts (e.g. 8.5″ x 11″) can be printed using a home printer. Larger charts (up to 42″ x 60″) can be printed using the services of a professional office printing company.
The NOAA Custom Chart tool can be found at https://devgis.charttools.noaa.gov/pod/.
Having experimented with the charttools product since it’s rollout, I personally find it to be very handy. During a recent Advanced Coastal Cruising class I produced and printed a chart book containing all of our cruising area on 11 x 17 paper. Students in the class had no issues with using the format, and found the size much more convenient than tradition raster chart products.